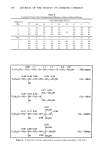
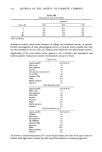
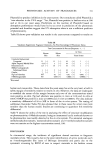
OPTIMIZATION TECHNIQUES 295 It should be emphasized that in these techniques we are not looking for the best of the experiments performed. We have now generated a set of continuous equations which can be evaluated to produce any combination of the independent variables. Once the predictor equation is available, one can begin to get a picture of the system by graphical representation. Figure 3 shows a computer drawn graph of pH as a function of Veegum level in the particular suspension under study. This type of curve represents only a partial description of the system since the independent variables not shown must be held constant at some level to obtain this curve they can be held constant at any level in the experimental range. Any property may be shown as a function of any independent variable in this manner. Xl=X2=X3=X•=X5=O. •VEEGUM• &KELTR•L / +NRTER xCITRIC RCIO Figure 4. Computer generated plot of Sedimentation Volume (dep. var.) as a function of each of the independent variables. Composite graphs (such as Figure 4 for sediment volume) can also be generated for all of the independent variables at once. This represents the superimposing of five of the previous graphs at once, and this is easily done by keeping the absissa in experimental (statistical) units, rather than physical units.

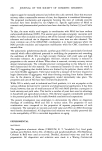
296 JOURNAL OF THE SOCIETY OF COSMETIC CHEMISTS Once the computer has the predictor equations, appropriate programs can search for the optimum formulation based upon the constraints which the formulatot specifies as described in a previous publication (10). The formulation (combination of independent variables) is specified by the computer and the properties (dependent variables) are predicted. The formulation can then be prepared in the laboratory and tested. For one such case, which represented a tablet formulation, the predicted and experimental properties are shown in Table VII. These data show that the objective was accomplished i.e., to find the exact quantities of ingredients which give the best combination of properties which are all good at the same time. Table VII Optimum Formulation For Tablet System Response Experimental Predicted Disintegration Time (min.) 3.31 3.03 Hardness (kg.) 10.08 10.38 Dissolution (% in 30 min.) 89.85 • 98.02 Friability (%) 0.18 - 0.38 •Highest value in the 27 experimental trials was 78% (after Ref. 10). OPTIMIZATION OF BIOLOGICAL PARAMETERS The next logical step was to say that if the physical properties of a dosage form are controlled by the formulation and can be predicted, it should also be true of the biological properties. Therefore, a joint project was undertaken with the Massachu- setts College of Pharmacy (12). In this case, three independent variables were selected as shown in Table VIII. They were disintegrant level, lubricant level and compressional force. Table VIII Variables for Optimization Study of Biological Properties Independent Variable Dependent Variable x• Starch Level x2 Magnesium Stearate Level x 3 Compressional Force y• Absorption Rate y2 Lag Time Y3 Elimination Rate Y4 Time of Plasma Peak •In addition to the usual properties such as tablet hardness, etc. Fifteen formulations were prepared and the properties measured. This time, however, the study was continued, by administering the tablets to dogs and collecting appropriate blood samples, so that in addition to the usual physical properties of the tablets, we added the pharmacokinetic properties: Time of the peak plasma concentra- tion. (min.) Lag time. (min.) Absorption rate constant. (min.-•) and Elimination rate constant. (min.-•). The drug in this case was hydrochlorothiazide and the blood level curves were analyzed by assuming first order elimination, first order absorption and a one-compartment model. (It should be obvious that a medicated cream, a dandruff shampoo, or a lotion for a specific biological purpose could be studied in the same manner.)
Purchased for the exclusive use of nofirst nolast (unknown)
From: SCC Media Library & Resource Center (library.scconline.org)