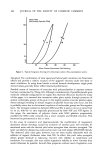
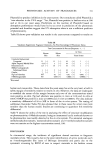
OPTIMIZATION TECHNIQUES 299 XI•X2•X3•Q oCORNST•RCH +?•E55U•E ' X[II Figure 7. Computer generated plot of Lag Time as a function of each independent variable. materials (in fact, they were prepared from the same granulation). They differ by only milligrams in two "pharmacologically inert" ingredients. Yet, they perform differently (one vs. two hour peak times). They also perform predictably and in a quantitative manner. CONCLUSIONS Although the two completed examples shown here related to tablet formulations, the techniques of optimization are applicable and are being applied to systems of interest in the disciplines of cosmetic chemistry, and in fact to any multivariate system. The data presented show that the properties of a drug or cosmetic product are a function of the formulation and processing of that product. Properly designed

300 JOURNAL OF THE SOCIETY OF COSMETIC CHEMISTS z• Xl:X2=X3:O O- oeORNSTRRoeH •- MRGNESIUH STERRRTE +- PRESSURE .z2 ' -b.ss -b.54 -b.2• o'.t3 0',46 o'.so Figure 8. Computer generated plot of Time of Peak Plasma Concentration as a function of each independent variable. experimentation and subsequent analysis can lead not only to the optimum or most desirable product and process but, if carried far enough, can shed light on the mechanism by which the independent variables affect the product properties. There area appropriate statistical techniques by which such analyses can be carried out (13,14). The important concept is that by rational experimentation, the formulatot is able to learn more about his system and thus he is more able to control it. REFERENCES (1) J. B. Schwartz, Optimization techniques in pharmaceutical formulation and processing, in Modern Pharmaceutics, G. S. Banker and C. T. Rhodes, Eds., (Marcel Dekker, Inc., New York, 1979) Chapt. 17.
Purchased for the exclusive use of nofirst nolast (unknown)
From: SCC Media Library & Resource Center (library.scconline.org)