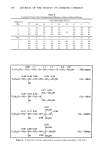
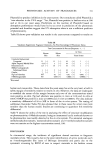
OPTIMIZATION TECHNIQUES 297 x• X1ZX2•X3•O •CORN5TRRCH &MR•NE5IUM 5TERRRTE •?RE5$URE Figure 5. Computer generated plot of Elimination Rate Constant as a function of each independent variable. By graphical observation, the elimination rate constant was (correctly) not a function of the independent variables (Figure 5). It was indeed relatively constant. The other three were functions of the formulation factors, as illustrated by the composite plots in Figures 6-8. By our computer search methods, we asked the computer for the optimum formula- tion with a tablet hardness of about 6.5 kg and a peak plasma concentration time of less than 60 min. This formulation was prepared and tested. The predicted vs. experimental results are shown in Table IX, and the agreement is excellent. In addition we requested from the computer the worst formulation with respect to peak time, but one exhibiting equivalent tablet hardness. We called this the anti- optimum, and the predicted vs. experimental data are also shown in Table IX. The tablets from the two batches look alike. They have equivalent hardness values. They have exactly the same ingredients qualitatively, from the same batches of raw

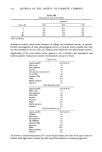
298 JOURNAL OF THE SOCIETY OF COSMETIC CHEMISTS X1ZX2ZXSZO •CORNSTRRCH •MRGNESIUM STERRRTE +PRESSURE -1.21 X{I) Figure 6. Computer generated plot of Absorption Rate Constant as a function of each independent variable. Table IX Optimum and Anti-Optimum Formulation Properties Optimum Anti-Optimum Predicted Actual Predicted Actual Tablet Hardness (kg) Rate of Elimination (rain-•) Rate of Absorption (min- •) Lag Time (min) Time of Plasma Peak (rain) 6.7 6.7 6.7 6,5 0.0064 0.0065 0.0069 0.0065 0.048 0.042 0.013 0.016 11.5 12.3 41.8 38.8 59.2 64.8 138.4 131.3
Purchased for the exclusive use of nofirst nolast (unknown)
From: SCC Media Library & Resource Center (library.scconline.org)