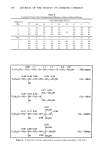
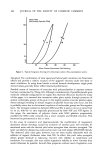
298 JOURNAL OF THE SOCIETY OF COSMETIC CHEMISTS X1ZX2ZXSZO •CORNSTRRCH •MRGNESIUM STERRRTE +PRESSURE -1.21 X{I) Figure 6. Computer generated plot of Absorption Rate Constant as a function of each independent variable. Table IX Optimum and Anti-Optimum Formulation Properties Optimum Anti-Optimum Predicted Actual Predicted Actual Tablet Hardness (kg) Rate of Elimination (rain-•) Rate of Absorption (min- •) Lag Time (min) Time of Plasma Peak (rain) 6.7 6.7 6.7 6,5 0.0064 0.0065 0.0069 0.0065 0.048 0.042 0.013 0.016 11.5 12.3 41.8 38.8 59.2 64.8 138.4 131.3

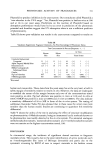
OPTIMIZATION TECHNIQUES 299 XI•X2•X3•Q oCORNST•RCH +?•E55U•E ' X[II Figure 7. Computer generated plot of Lag Time as a function of each independent variable. materials (in fact, they were prepared from the same granulation). They differ by only milligrams in two "pharmacologically inert" ingredients. Yet, they perform differently (one vs. two hour peak times). They also perform predictably and in a quantitative manner. CONCLUSIONS Although the two completed examples shown here related to tablet formulations, the techniques of optimization are applicable and are being applied to systems of interest in the disciplines of cosmetic chemistry, and in fact to any multivariate system. The data presented show that the properties of a drug or cosmetic product are a function of the formulation and processing of that product. Properly designed
Purchased for the exclusive use of nofirst nolast (unknown)
From: SCC Media Library & Resource Center (library.scconline.org)