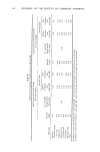
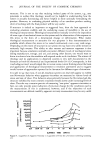
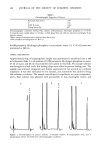
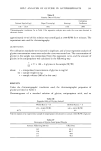
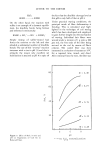
360 JOURNAL OF THE SOCIETY OF COSMETIC CHEMISTS Table I Chromatographic Properties of Glycine • Retention Time (min.): 9.8* k': 8.16 H.E.T.P. (mm): 0.022 Tailing Factor (%): 85** •Chromatographic conditions: Zorbax NH2, column .01M potassium dihydrogen phosphate in 7:3 (V/V) Acetonitrile water, mobile phase 2.0 ml/min., mobile phase flow rate 200 nm, detection wavelength 50/•1, injection volume. *Slight change of retention time is observed from day to day. **For calculation of tailing factor see Ref. (3). O.01M potassium dihydrogen phosphate in acetonitrile: water (7:3 V/V). Glycine was monitored at 200 nm. SAMPLE PREPARATION Approximately 0.5g of antiperspirant sample was quantitatively transferred into a 100 ml volumetric flask. A 3 ml solution of O.SM potassium dihydrogen phosphate in water, 45 ml of water, and 40 ml of acetonitrile were added to this flask. The sample solution was brought to a boil, and a few boiling chips were added to prevent boiling over. The sample was removed, stoppered, and shaken vigorously for ten seconds to a uniform dispersion. It was then sonicated for ten minutes, and acetonitrile was added to bring this solution to volume. The sample was allowed to equilibrate to room temperature, and a final volume was adjusted with acetonitrile. It was thoroughly mixed, and gr. Figure 1. Chromatograms of glycine analysis. A standard solution, B antiperspirant stick, and C antiperspirant roll-on. See Table I for chromatographic conditions.

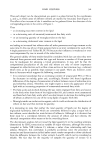
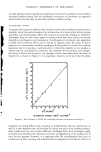
HPLC ANAI,YSIS OF GLYCINE IN ANTIPERSPIRANTS 361 Table II Linearity Data of Glycine 1 Correlation Amount Injected (ug) Slope (Counts/ug) Intercept Coefficient 5.46 -- 18.19 3092 1750 .9999 tChromatographic conditions: As in Table I. For regression analysis, area under the curve was obtained in electronic counts. approximately 10 ml of this solution was centrifuged at 2500 RPM for 5 minutes. The supernatant was used for chromatography. QUANTITATION The calibration standards were injected in duplicate, and a linear regression analysis of glycine concentration versus area under the curve was carried out. The concentration of glycine in the sample was interpolated from this regression curve, and the amount of glycine in the antiperspirant was calculated in the following way: c sw -- x V x 100 = % glycine in the sample (W/W) where c = interpolated concentration of glycine in mg/ml sw = sample weight in mg v = sample volume (100 ml in this case) RESULTS Under the chromatographic conditions used, the chromatographic properties of glycine are listed in Table I. Chromatograms of a standard solution of glycine, antiperspirant stick, and an Table III Reproducibility of Glycine Analysis • Within-Run (n = 9) Between-Run (n = 3) 3.59 -+ 0.04% (W/W) 3.60 _+ 0.02% (W/W) % CV 1.1 0.6 •Glycine analysis of an experimental sample of antiperspirant stick known to contain 3.64% (W/W) of glycine. Table IV Recoveries of Glycine From Spiked Placebo Amount Added (rag/100 ml) % Recovery 26.5 101.4 22.0 101.7 17.1 99.9 11.7 96.3
Purchased for the exclusive use of nofirst nolast (unknown)
From: SCC Media Library & Resource Center (library.scconline.org)