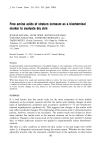
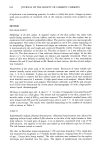
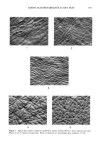
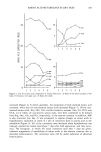
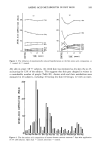
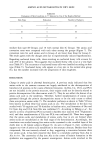
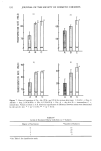
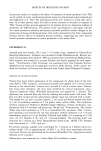
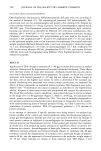
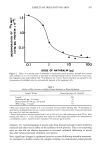
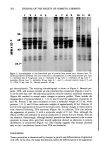
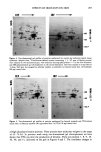
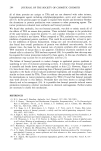
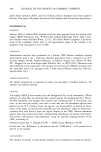
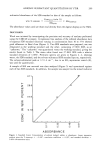
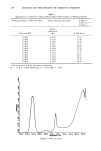
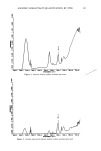
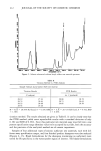
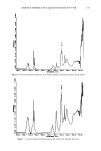
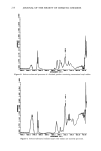
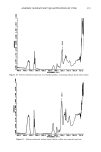
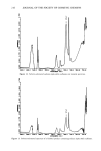
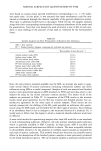
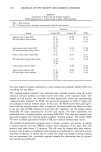
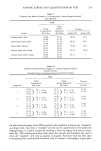
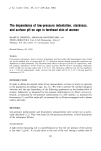
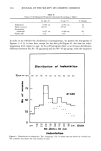
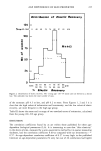
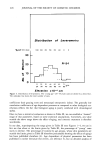
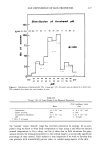
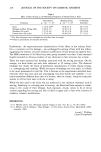
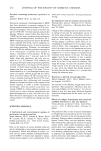
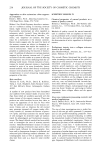
202 JOURNAL OF THE SOCIETY OF COSMETIC CHEMISTS I 2 3 4 5 6 7 8 9 10 11 12 . : :- 93- 25.7- Figure 3. Autoradiograph of one-dimensional gels of proteins from treated mice. Extracts from 35S- methionine-labeled epidermal cells were subjected to electrophoresis on 10% polyacrylamide gels. Lane 1--Anthralin dose of 5 I•g/mouse. Lane 2--Anthralin, 10 I•g. Lane 3--Anthralin, 20 I•g. Lane 4-- Anthralin, 40 I•g. Lane 5--Anthralin, 80 I•g. Lanes 6, 7, and 11--Acetone controls. Lanes 8, 9, and 12--TPA, 10 I•g. Lane 10--Benzoyl peroxide, 40 mg. gel electrophoresis. The resulting autoradiograph is shown in Figure 4. Benzoyl per- oxide, TPA, and acetone controls are also presented for comparison (Figures 4 and 5). It can be seen that over 100 individual proteins could be resolved. Anthralin treatment (Figure 4b) resulted in several major changes in protein profiles. These include the disappearance of proteins labeled 2, 7, 8, 9, and 10 and the appearance of proteins 43 and 46. Protein 2 has been estimated to have a molecular weight of 52 kd, while proteins 7, 8, 9, and 10 have molecular weights of approximately 62 kd. Proteins 43 and 46 were approximately 64 and 56 kd respectively. Similar changes in these proteins were observed following TPA treatment (Figure 5b). In addition, TPA also induced the appearance of protein 51 with a molecular weight of 51 kd. Thus, although the effects of TPA and anthralin on protein production in mouse skin are similar, they are not identical. Interestingly, although benzoyl peroxide has been reported to be a tumor promoter in mouse skin, gels from treated epidermis showed no alteration in protein distribution or production (Figure 5a). This finding suggests that benzoyl peroxide may act by a mechanism distinct from TPA and anthralin. DISCUSSION Tumor promotion is characterized by changes in growth and differentiation of epidermal cells (19). In the skin, the major biochemical marker for differentiation is the appearance

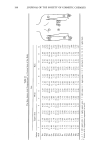
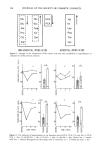
EFFECTS OF IRRITANTS ON SKIN 203 IEF = IEF • 789 ,! :, t10 -68 .. - '46.- '-"' ,..2 ":. -43 I -25.7 Figure 4. Two-dimensional gel profiles of proteins synthesized by control and anthralin-treated mouse epidermis. Samples from •SS-methionineolabeled extracts (containing 1 x 10⁵ cpm of labeled protein) were analyzed on two-dimensional gels, with isoelectric focusing (pH gradient 5-7) in the first dimension and SDS-polyacrylamide gel electrophoresis in the second dimension. Gels were exposed to x-ray film for 14 days. Each spot was assigned an arbitrary number, as indicated. (a) Control mouse skin. (b) Anthralin (80 Ixg) treated skin. -25.7 Figure 5. Two-dimensional gel profiles of proteins synthesized by benzoyl peroxide and TPA-treated mouse skin. (a) Benzoyl peroxide (40 mg)-treated skin. (b) TPA (10 Ixg)-treated skin. of high abundance keratin proteins. These proteins have molecular weights in the range of 45-70 kd. In previous work using two-dimensional gel electrophoresis we have shown that TPA can alter the production of keratins. These are proteins 7, 8, 9, 10, 43, 46, and 51, indicated on the gels in Figures 4 and 5. The coordinate changes in
Purchased for the exclusive use of nofirst nolast (unknown)
From: SCC Media Library & Resource Center (library.scconline.org)