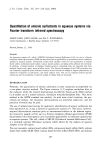
J. Soc. Cosmet. Chem., 35, 207-220 (July 1984) Quantitation of anionic surfactants in aqueous systems via Fourier transform infrared spectroscopy MARIE SABO, JOHN GROSS, and IRA E. ROSENBERG, Clairol Incorporated, 2 Blachley Road, StamJ•rd, CT 06922. Received January 23, 1984. Synopsis An innovative sample cell, called a CIRCLE (Cylindrical Internal Reflectance Cell), for use in a Fourier transform infrared spectrometer (FTIR) has been tested for its applicability to quantitative anionic surfactant analyses in aqueous systems. Preliminary studies show excellent results for the quantitation of sodium lauryl sulfate, ammonium lauryl sulfate, sodium laureth sulfates, and alpha olefin sulfonate raw materials. In addition, a limited number of shampoo finished products containing these raw materials have been analyzed directly and, again, show excellent results. The distinct advantages of the FTIR procedure over the commonly employed mixed indicator titration method include no sample or reagent preparations, no subjective evaluations of end-points, and rapid analysis time. The use of computer-assisted spectral subtraction and the possibility of spectral storage on floppy disks are discussed. INTRODUCTION Presently, the quantitation of anionic surfactants is most commonly accomplished via a two-phase titration method. The Epton titration (1,2) employs methylene blue as the indicator while the Comit6 International des D6riv6s Tensio-actifs (CID) method (3,4) makes use of a mixed indicator, dimidium bromide/disulphine blue. This latter method is the ASTM standard test method. As with most visual titrations, the pro- cedures are tedious, the end-point determinations are somewhat subjective, and the precision of results may be poor. The use of infrared spectroscopy for qualitative identification of anionic surfactants has been reported (5,6), as has a method of quantitative analysis (7). The latter, however, required derivatization reactions prior to instrumental analysis in the infrared region. An innovative sample cell for use in a Fourier transform infrared spectrometer (FTIR) has prompted this investigation into its possible applicability to surfactant quantitation in aqueous systems. The cell, called a CIRCLE (Cylindrical Internal Reflectance Cell), is a multiple internal reflectance accessory which allows for the analysis of aqueous samples in the IR region. Five raw materials, sodium lauryl sulfate (SLS), ammonium lauryl sulfate (ALS), sodium lauryl ether sulfate (SLES- lEO), sodium lauryl di-ether sulfate (SLES-2EO), and sodium 2O7

208 JOURNAL OF THE SOCIETY OF COSMETIC CHEMISTS alpha olefin sulfonate (AOS), and four finished product shampoos have been analyzed thus far. This paper will present the results of the analyses and discuss their significance. EXPERIMENTAL REAGENTS Sodium dodecyl sulfate (SDS) standard solutions were prepared from the assayed solid reagent (BDH Chemicals, Ltd., #44244-4H, Gallard-Schlesinger Chem. Mfg. Corp). and distilled water (Purified Water, U.S.P., Electrified Water Company). Concentra- tions of the standards, which were in the approximate range of the samples to be analyzed, were calculated as w/w % SDS. APPARATUS Instrumental analyses were performed on a Nicolet 5MX Fourier transform infrared spectrometer with 4 cm-• resolution (Nicolet Instrument Corp.) attached to an X-Y recorder (Model 7010B, Hewlett-Packard). A diskette storage drive (Model SA 800/ 801, Shugart) for use with floppy disks (Flexible Disc is, #32013015, Memorex) was also interfaced to the instrument. The sample cell used was the CIRCLE accessory with the open-boat micro cell equipped with a ZnSe crystal (Barnes Analytical Division, Spectra-Tech, Inc.). SAMPLE PREPARATION No sample preparation is required on either raw materials or finished products. All samples are analyzed directly. ANALYSIS The empty CIRCLE was scanned into the background file of the instrument. (When plotted, all other files are automatically ratioed against the background file.) Water, the SDS standards, and samples were scanned into remaining files. A two-minute scan time, at one scan per second, was used in each case and the absorbance spectra were plotted on the X-Y recorder. From the spectra, the wavenumbers of maximum absor- bance of the peaks of interest were identified and the absorbance values at those wave- numbers were read directly from the digital display on the 5MX. Solvent-subtracted spectra were also plotted and their corresponding absorbances of interest determined. The solvent subtractions were performed, using the spectral stripping feature of the 5MX, according to: Subtracted spectrum = (Sample file #) - (DIFF factor) (Reference file #). In this case, the "Reference" is the solvent and the "DIFF factor" is the proportion of solvent in the sample. CALCULATIONS The amount of anionic in each sample analyzed was calculated by ratioing the solvent-
Purchased for the exclusive use of nofirst nolast (unknown)
From: SCC Media Library & Resource Center (library.scconline.org)