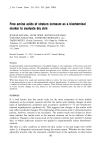
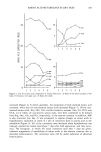
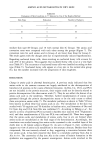
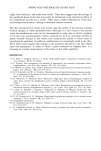
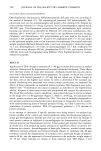
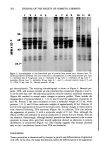
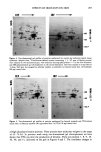
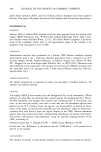
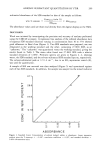
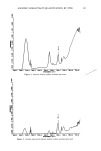
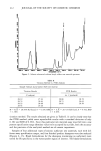
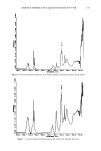
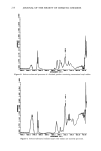
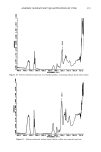
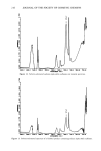
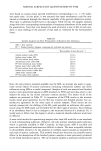
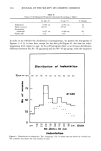
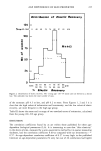
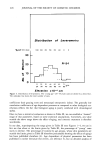
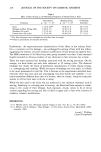
ANIONIC SURFACTANT QUANTITATION BY FTIR 209 subtracted absorbance of the SDS standard to that of the sample as follows: w/w % anionic = Conc(sTr)) (w/w %) AbS(sTD) X AbS(sAMPLE) The absorbance values used are those read directly from the digital display on the 5MX. DISCUSSION Work was initiated by investigating the precision and accuracy of analyses performed using the CIRCLE accessory. A regression line analysis of the infrared absorbance data of aqueous SDS standard solutions varying in concentration from 10 to 37% showed good adherence to Beer's Law (Figure 1). Two SDS standards were prepared one was designated as the working standard and the other, containing 27.80% SDS, as an "unknown." The "unknown" was quantitated versus the working standard, giving the results found in Table I. The mean value found was 27.86% SDS with a relative standard deviation of 1.08%. Pertinent spectra are given in Figures 2-4, showing water, the SDS standard, and the solvent-subtracted SDS standard spectra, respectively. The solvent-subtracted peak at 1211.4 cm-•, due to an SO3 asymmetric stretch (8), was used for quantitation. A sample of SLS raw material was then analyzed (Figure 5) and quantitated against each of two SDS standards. In addition, the sample was assayed via the mixed indicator 37.1 I'-- Z 29.5 LLI (,..) r'r' LLI Q_ 19.9 Z (,..) Z 9.79 x o d d d ABSORBANCE Figure 1. Standard Curve: Concentration of sodium dodecyl sulfate vs absorbance. Linear regression analysis gives the Y-intercept = -0.487, correlation coefficient = 0.997, and standard deviation = 0.844 concentration units.

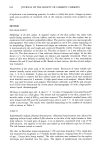
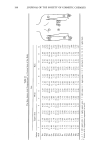
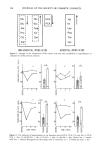
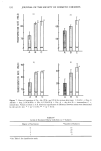
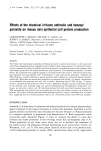
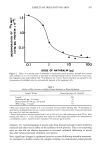
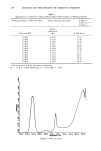
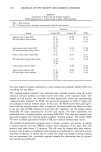
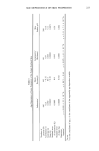
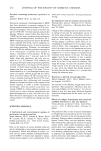
210 JOURNAL OF THE SOCIETY OF COSMETIC CHEMISTS Table I Quantitation of "Unknown" Sodium Dodecyl Sulfate (SDS) Standard vs. Working Standard Working standard: 26.68% w/w SDS Solvent subtracted Abs values: 0.3994 a.u. 0.4019 a.u.* 0.4028 a.u. "Unknown STD" Solvent Subtracted Abs % SDS Found 27.80% 0.4155 27.61 27.80% 0.4131 27.46 27.80% 0.4161 27.66 27.80% 0.4167 27.70 27.80% 0.4256 28.29 27.80% 0.4146 27.56 27.80% 0.4191 27.85 27.80% 0.4172 27.73 27.80% 0.4217 28.03 27.80% 0.4264 28.34 27.80% 0.4186 27.82 27.80% 0.4252 28.26 * The mean value, 0.4014, was used in calculations. -- N = 12 X = 27.86% SDS found (y = 0.302 RSD = 1.08%. 4000ø0 Figure 2. Water spectrum.
Purchased for the exclusive use of nofirst nolast (unknown)
From: SCC Media Library & Resource Center (library.scconline.org)