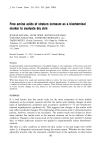
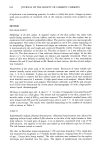
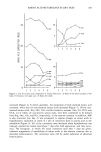
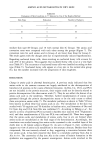
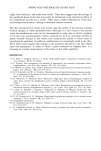
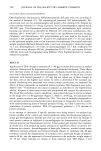
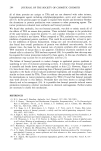
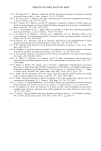
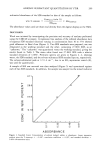
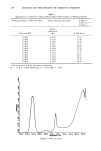
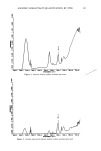
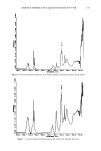
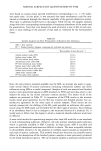
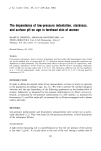
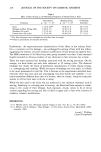
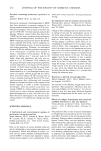
ANIONIC SURFACTANT QUANTITATION BY FTIR 211 460•.0 4OO•.O •400.0 •00.O •..DO. O •OO.O •:10.O •00.O •OO•.O nSO.00 *700.00 Figure 3. Sodium dodecyl sulfate standard spectrum. 4600.0 4000.0 3'I[X] oO P. eOO.D • .O lor•.o 1600.0 1300.0 1000.0 O•O. O0 71X].00 •IIWE:M. XIIIBF. Jl• (C1'1-11 Figure 4. Solvent-subtracted sodium dodecyl sulfate standard spectrum.

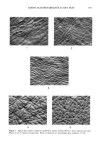
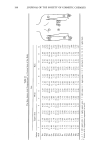
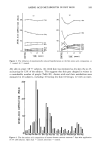
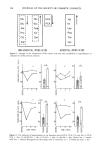
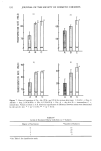
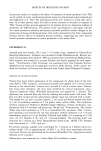
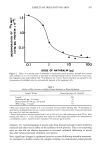
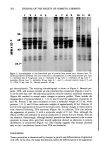
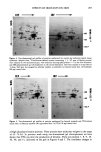
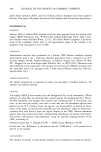
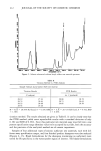
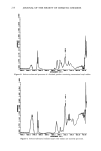
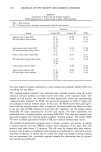
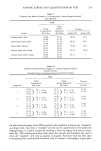
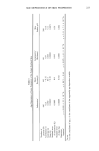
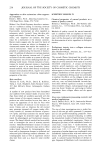
212 JOURNAL OF THE SOCIETY OF COSMETIC CHEMISTS I •,D I•KJ.O 1600.0 ! I I I lqnn. O lnru'l.n B•D. r',n 7r',n. r',n Figure 5. Solvent-subtracted sodium lauryl sulfate raw material spectrum. Table II Titration Method vs. FTIR Analysis Sample: Sodium lauryl sulfate (SLS) raw material Titration Results (2 analysts) 28.19 27.94 28.74 28.64 28.22 28.68 28.43 29.20 N = 8 X = 28.50% SLS found cr = 0.395 RSD = 1.38%. FTIR Results (vs. 2 standards) 28.86 28.78 28.73 28.64 28.66 28.58 N = 6 X = 28.71% SLS found cr = 0.102 RSD = 0.36%. titration method. The results obtained are given in Table II. It can be clearly seen that the FTIR method yields more reproducible results with a standard deviation of only 0. 102 and RSD of 0.36%. Since this particular raw material assay must fall into a one percent specification range (absolute value) to be accepted by our labs, both the accuracy and the precision of the analytical method are of utmost importance. Samples of four additional types of anionic surfactant raw materials, each with dif- ferent assay specification ranges, and four finished product shampoos were also analyzed (Figures 6-13). Blank formulations for the shampoos (containing no surfactant) were tested for IR specificity in the wavenumber region of interest. The blank formulations
Purchased for the exclusive use of nofirst nolast (unknown)
From: SCC Media Library & Resource Center (library.scconline.org)