208 JOURNAL OF THE SOCIETY OF COSMETIC CHEMISTS alpha olefin sulfonate (AOS), and four finished product shampoos have been analyzed thus far. This paper will present the results of the analyses and discuss their significance. EXPERIMENTAL REAGENTS Sodium dodecyl sulfate (SDS) standard solutions were prepared from the assayed solid reagent (BDH Chemicals, Ltd., #44244-4H, Gallard-Schlesinger Chem. Mfg. Corp). and distilled water (Purified Water, U.S.P., Electrified Water Company). Concentra- tions of the standards, which were in the approximate range of the samples to be analyzed, were calculated as w/w % SDS. APPARATUS Instrumental analyses were performed on a Nicolet 5MX Fourier transform infrared spectrometer with 4 cm-• resolution (Nicolet Instrument Corp.) attached to an X-Y recorder (Model 7010B, Hewlett-Packard). A diskette storage drive (Model SA 800/ 801, Shugart) for use with floppy disks (Flexible Disc is, #32013015, Memorex) was also interfaced to the instrument. The sample cell used was the CIRCLE accessory with the open-boat micro cell equipped with a ZnSe crystal (Barnes Analytical Division, Spectra-Tech, Inc.). SAMPLE PREPARATION No sample preparation is required on either raw materials or finished products. All samples are analyzed directly. ANALYSIS The empty CIRCLE was scanned into the background file of the instrument. (When plotted, all other files are automatically ratioed against the background file.) Water, the SDS standards, and samples were scanned into remaining files. A two-minute scan time, at one scan per second, was used in each case and the absorbance spectra were plotted on the X-Y recorder. From the spectra, the wavenumbers of maximum absor- bance of the peaks of interest were identified and the absorbance values at those wave- numbers were read directly from the digital display on the 5MX. Solvent-subtracted spectra were also plotted and their corresponding absorbances of interest determined. The solvent subtractions were performed, using the spectral stripping feature of the 5MX, according to: Subtracted spectrum = (Sample file #) - (DIFF factor) (Reference file #). In this case, the "Reference" is the solvent and the "DIFF factor" is the proportion of solvent in the sample. CALCULATIONS The amount of anionic in each sample analyzed was calculated by ratioing the solvent-

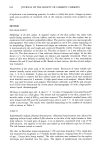
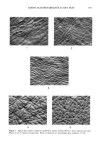
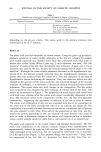
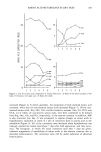
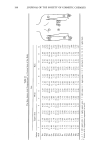
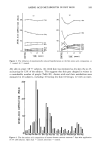
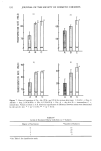
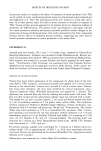
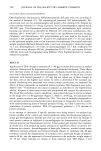
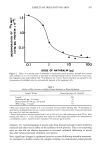
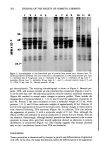
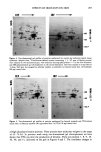
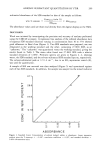
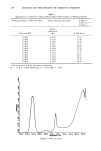
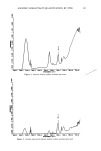
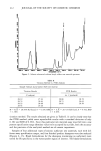
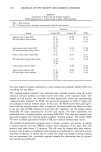
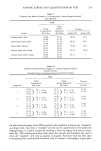
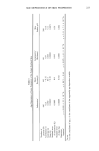
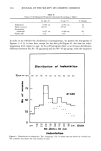
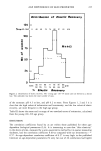
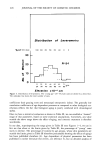
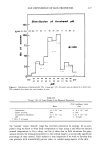
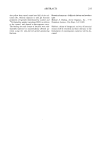
ANIONIC SURFACTANT QUANTITATION BY FTIR 209 subtracted absorbance of the SDS standard to that of the sample as follows: w/w % anionic = Conc(sTr)) (w/w %) AbS(sTD) X AbS(sAMPLE) The absorbance values used are those read directly from the digital display on the 5MX. DISCUSSION Work was initiated by investigating the precision and accuracy of analyses performed using the CIRCLE accessory. A regression line analysis of the infrared absorbance data of aqueous SDS standard solutions varying in concentration from 10 to 37% showed good adherence to Beer's Law (Figure 1). Two SDS standards were prepared one was designated as the working standard and the other, containing 27.80% SDS, as an "unknown." The "unknown" was quantitated versus the working standard, giving the results found in Table I. The mean value found was 27.86% SDS with a relative standard deviation of 1.08%. Pertinent spectra are given in Figures 2-4, showing water, the SDS standard, and the solvent-subtracted SDS standard spectra, respectively. The solvent-subtracted peak at 1211.4 cm-•, due to an SO3 asymmetric stretch (8), was used for quantitation. A sample of SLS raw material was then analyzed (Figure 5) and quantitated against each of two SDS standards. In addition, the sample was assayed via the mixed indicator 37.1 I'-- Z 29.5 LLI (,..) r'r' LLI Q_ 19.9 Z (,..) Z 9.79 x o d d d ABSORBANCE Figure 1. Standard Curve: Concentration of sodium dodecyl sulfate vs absorbance. Linear regression analysis gives the Y-intercept = -0.487, correlation coefficient = 0.997, and standard deviation = 0.844 concentration units.
Purchased for the exclusive use of nofirst nolast (unknown)
From: SCC Media Library & Resource Center (library.scconline.org)