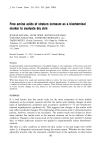
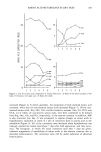
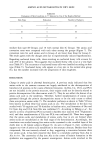
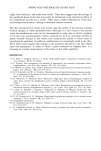
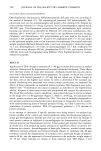
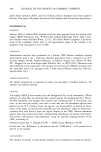
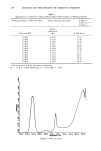
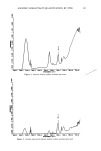
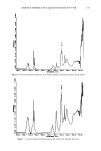
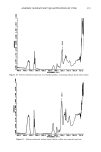
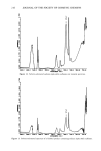
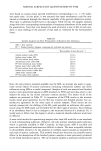
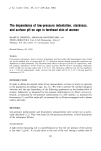
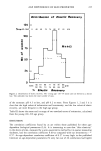
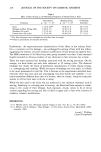
216 JOURNAL OF THE SOCIETY OF COSMETIC CHEMISTS i i i i i i i 4•1•0,0 4000,0 :•1•0,0 •01•,0 •1•0,0 1•0,0 16•0,0 1•1:•,0 11•n,o •o.nn •1•o,nn Figure 12. Solvent-subtracted sodium alpha olefin sulfonate raw material spectrum. •,0 4000,0 •41•0,0 • ,0 I 8P..I•,O I•0,0 16•0,0 I•C•O,O lnnn,o BSO, nn Figure 13. Solvent-subtracted spectrum of a finished product containing sodium alpha olefin sulfonate.

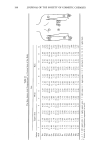
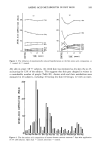
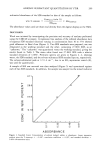
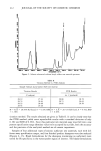
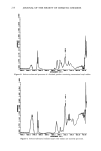
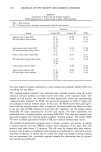
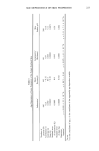
ANIONIC SURFACTANT QUANTITATION BY FTIR 217 were found to contain minor spectral interferences corresponding to ca. 1-2% surfac- rant assay value. At this point, it was assumed that these interferences could be min- imized or eliminated through the inherent capability of the spectral subtraction system. This topic is addressed further later in this paper. Table II1 lists the samples analyzed along with their corresponding wavenumbers of maximum absorbance of the peaks used for quantitation. Note that even though the peak of interest is due to SO 3 in each case, there is some shifting of the position of that peak as evidenced by the wavenumbers listed. Table III Samples Analyzed and Their Wavenumbers of Maximum SO 3 Absorbance RM = Raw material FP = Finished product shampoo containing the indicated raw material Sample Wavenumber of max Abs (cm-•) Sodium dodecyl sulfate STD Sodium lauryl sulfate RM FP with sodium lauryl sulfate Ammonium lauryl sulfate RM FP with ammonium lauryl sulfate Sodium lauryl ether sulfate RM FP with sodium lauryl ether sulfate Sodium lauryl diether sulfate RM Alpha olefin sulfonate RM FP with alpha olefin sulfonate 1211.4 1211.4 1211.4 1205.6 1205.6 1215.2 1215.2 1215.2 1174.7 1174.7 Since the only primary standard available was the SDS, an attempt was made to quan- tirate several classes of anionic surfactants (including ethoxylated sulfates and olefin sulfonates) using SDS as a model compound. Samples of each raw material and finished product were quantitated against an SDS standard via FTIR and were also given to two analysts for assay by the mixed indicator titration method. The results of all of the analyses are presented in Table IV. A comparison of the FTIR results to the titration results shows good agreement for the SLS raw material and finished product but un- satisfactory agreement for the other types of anionic samples. These results are not entirely unexpected the shifting of the SO 3 peak provided an indication that quanti- tation using the SDS might not be feasible for the other types of anionics. Since shifting of an absorbance band is due to changes in the structural features of a molecule (9), it would seem to follow that the degree to which a molecule absorbs radiation would also be affected. A more valid method for quantitating samples other than SLS would be to use standards of each corresponding surfactant. However, the only primary standard grade surfactant which is generally available is SDS. Certainly, no high purity AOS is available and pure cuts of ethoxylated surfactants are difficult to obtain. The most acceptable solution to this problem seemed to be the adoption of carefully assayed samples as standards for each type of anionic surfactant. This method would also minimize any possible matrix effects in the absorptions of the finished product samples as were previously evidenced by the blank formulation spectra. The use of assayed samples as standards would provide
Purchased for the exclusive use of nofirst nolast (unknown)
From: SCC Media Library & Resource Center (library.scconline.org)