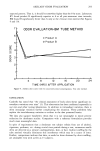
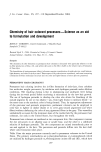
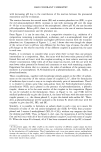
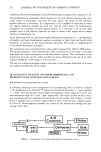
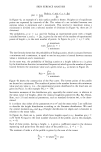
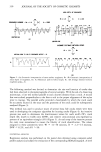
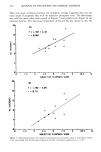
312 JOURNAL OF THE SOCIETY OF COSMETIC CHEMISTS evaluating skin microtopography (2) and for measuring its changes due to aging (3,5,6). The profilometrical parametric values depend on the scan direction because the cuta- neous surface is anisotropic (1,2,4,8). For this reason, the choice of the optimum angular direction is necessary. It is imperative to do a number of scans and to select the angular direction suitable for each site. On the other hand, the profilometric parameters are calculated for each separate profile. It is necessary to do at least three parallel scans in the selected direction in order to obtain valid results which permit statistical comparisons (1). In the following work we used some height distribution parameters (i.e., the frequency of heights and their distributions analyzed according to their third and fourth order moments, in addition to the autocorrelation function). This study is complementary to the above-mentioned technique. The parameters were calculated from a skin profile ranging from 1000 to 4000 points. The method permits a three-dimensional (3-D) reconstruction to be made at the same time from the stylus movements on the skin surface replicas. The coordinates of any interesting structure on the surface studied are easily observed by the use of an inde- pendent amplified (3-D) image of this structure. The use of a computer program replaces the need to scan in many directions, as it gives an overall quantification of the surface. QUANTITATIVE ANALYSIS AND THREE-DIMENSIONAL (3-D) REPRESENTATION OF HUMAN SKIN SURFACE DESCRIPTION OF THE MEASUREMENT SYSTEM A schematic drawing of the arrangement of the measuring device is shown in Figure 1: the profilometer is a Talysurf 5 © (radius of curvature of the stylus = 2 }xm pressure = 1 mN). Two step-by-step motors allow the samples to move along the x and y axes with minimum steps of 0.1 and 1 ptm, respectively. The stylus is fixed on the x and y axes and measures the z dimension of each point on the surface. The height, z, of each point is changed into an electric signal which is then converted into a digital signal. A Victor S1 microcomputer operates the control of the motors plus storage and pro- cessing of the data. Z • unit I unit] A/D [Printer J I /ideo ] Figure 1. Arrangement of the three-dimensional and measuring devices.

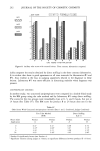
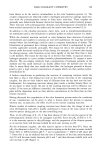
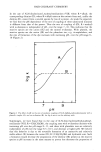
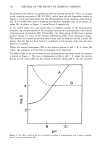
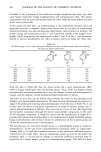
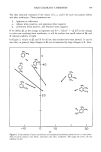
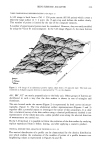
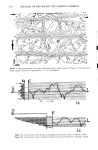
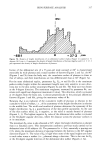
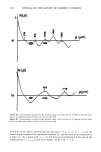
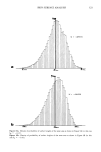
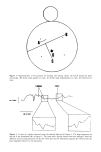
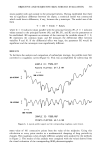
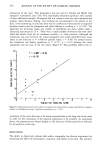
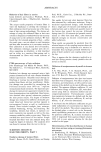
SKIN SURFACE ANALYSIS 313 THREE-DIMENSIONAL REPRESENTATION (3-D) (Figure 2) A 3-D image is built from a 256 X 256 point matrix (65536 points) which covers a relatively large surface (4 X 4 mm). the 15-•m step used defines the surface clearly. This number of points is limited by the size of the computer memory. A number of experimental points must be considered. However, they are easily satisfied by using the Victor S 1 microcomputer. In the 3-D image (Figure 2), the main furrows 200p m OOpm 200pro Figure 2. 3-D image of an abdominal positive replica taken from a 55-year-old male. The body ax•s considered as O-degree angular direction is represented by --• x in the diagram. AA', BB', CC' are nearly perpendicular to the body axis. Other groups of furrows are distributed in such a way that the skin surface is shown in sets of triangles and rhombuses. The area located under the arrows (Figure 2) is represented by level curves (microcar- tography, Figure 3). The two abdominal surface representations (Figures 2 and 3) together offer a powerful means to investigate the nature of skin anisotropy. It is clear that a statistical survey of the skin surface using a classical profilometric method is not representative of the whole skin area, unless parallel scans along the selected direction of measurement are carried out. By the 3-D method, it is possible to follow the evolution of the skin surface by studying replicas reproduced from it before, during, and after applying a cosmetic product. VERTICAL DISTRIBUTION ANALYSIS OF PROFILES (9,10,11,12) The vertical distribution of a profile can be characterized by the density distribution p(z) which enables the evaluation of the number of points of a profile between two neighboring values as represented in Figures 4a and 4b.
Purchased for the exclusive use of nofirst nolast (unknown)
From: SCC Media Library & Resource Center (library.scconline.org)