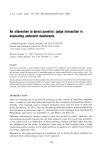
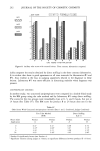
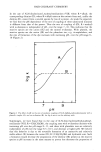
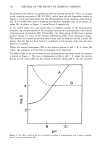
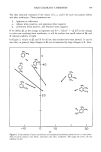
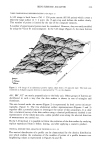
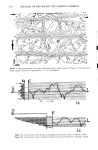
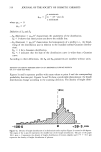
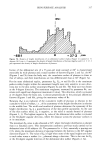
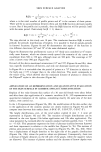
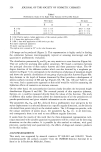
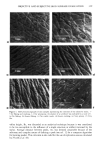
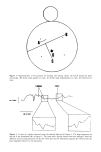
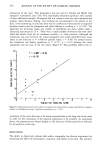
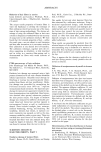
322 JOURNAL OF THE SOCIETY OF COSMETIC CHEMISTS Figure 9. A. 3-D representation of volar forearm before application of a cosmetic product (00). B. 3-D representation of volar forearm after 3 days application of a cosmetic product (00). well demonstrated by the 3-D representations (Figures 9A, 9B). The height distribution became more coherent after the (0.0) application. There was a decrease of 4% (standard deviation). There was no significant variation of the E• value. A profilometric study, at 90 degrees with respect to the volar forearm axis, was carried out on the same replicas. After the application of the cosmetic product, the amplitude parameter Rtm (measuring depth of furrows) decreased, while SM (measuring spacings between furrows) increased (Table i). There is a good correlation between the 3-D image results and the profilometric parametrical values. DISCUSSION AND CONCLUSIONS This work demonstrates the possibility of describing and evaluating the cutaneous relief by suitable specific parameters. Evaluation of the third and fourth moments of the statistical distribution of heights is essential to the characterization of skin relief by its vertical components. Knowing the position of each point on the surface, z = f(x,y), a

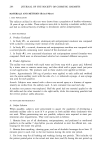
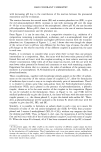
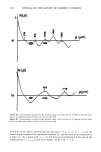
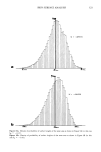
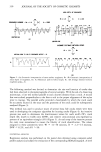
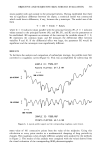
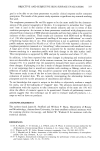
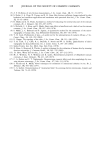
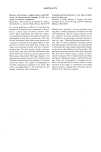
SKIN SURFACE ANALYSIS 323 a SK = -.3690431 -.4261558 b ZMin. ZMez. Figure 10a. Density of probability of surface heights of the same area as shown in Figure 9A (in this case S•: = -0.37). Figure lob. Density of probability of surface heights of the same area as shown in Figure 9B (in this case S•: = -0.43).
Purchased for the exclusive use of nofirst nolast (unknown)
From: SCC Media Library & Resource Center (library.scconline.org)