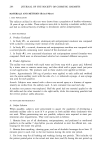
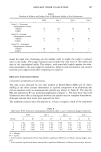
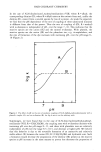
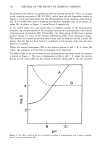
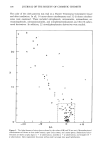
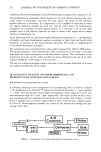
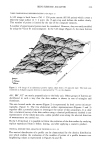
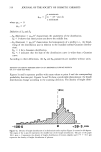
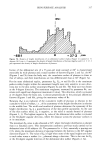
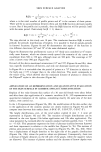
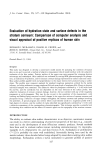
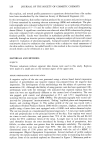
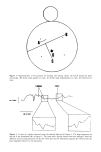
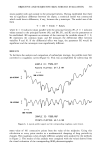
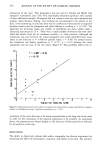
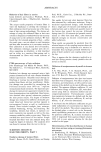
316 JOURNAL OF THE SOCIETY OF COSMETIC CHEMISTS where Ix(i) = 0 Ix(2) = 0'2 ( z maximum Ix(n) -- J(Z -• .•)n ' p(z) dz z minimum Definition of Si and --'Si• (Skewness) = Ix(3)/0' 3 characterizes the asymmetry of the distribution. Si• 0 shows that mos• points are above the middle line. --.E•: (Kurtosis) = Ix(4)/0' 4 characterizes the homogeneity of a profile (i.e., the broad- ening of the distribution p(z) in relation to the standard normal Gaussian distribu- tion). Ei• = 3 for a Gaussian distribution. Ei• 3 indicates that the base of the distribution curve is wider than a Gaussian curve. According to their definitions, the SK and E•: parameters are numbers without units. DENSITY OF HEIGHT DISTRIBUTION OF AN ABDOMINAL SURFACE REPLICA OF A 55-YEAR-OLD MALE Figures 5a and b represent profiles with mean values at point 0 and the corresponding probability function p(z). Figures 5a and 5b show a predictable phenomenon: the height distributions change according to the scanning direction. The density of height distri- 'P(z) I I z - 106-5 0 -+ 39' 3 Figure 5a. Density of height distribution of an abdominal surface replica (Figure 2) scanned at 60 degrees. The origin of the x axis (0) represents the middle line of the height distribution. The part of the graph 106.3 p,m --- 0 represents the density of height distribution of furrows (depths) and 0 '- + 39.3 p,m represents the density of height distribution of plateaus.

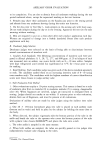
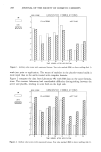
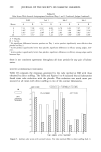
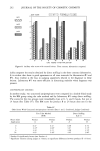
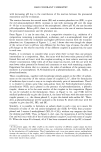
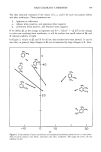
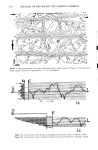
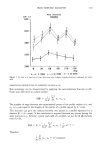
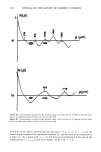
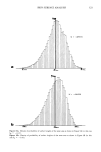
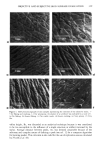
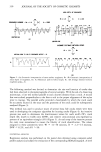
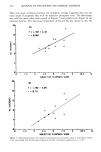
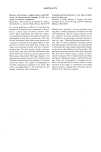
SKIN SURFACE ANALYSIS 317 -68.1 I IP(z) I I +37-3 z Figure 5b. Density of height distribution of an abdominal surface replica (Figure 2) scanned at )i• degrees: 68.1 pbm •- 0 represents the density of height distribution of furrows (depths) and 0 -- + 37.3 pbm represents the density of height distribution of plateaus. bution of the abdominal site of a 55-year-old male scanned at 60 ø is characterized essentially by wide plateaus and a small number of furrows (Figures 2 and 5a). At 90 ø (Figures 2 and 5b) from the body axis, the cumulative surface of plateaus is closer to that of valleys, and their distributions are less differentiated than at 60 ø (Figure 5a). For the same abdominal replica, parameters Si•, Ei•, g and Rt (Rt is the maximum peak-to-valley height within the assessment length) were very sensitive to scan direc- tions due to the skin surface anisotropy (Figures 6a and 6b). The body axis was chosen as the O-degree direction. The maximum roughness, measured by parameter Rt, cor- relates with significant dispersion (maximum g value). This direction, which is situated at 20 degrees from the body axis, is almost perpendicular to the principal abdominal furrows (Figures 3 and 6b), giving the maximum values of Rt. Skewness (SiO is an indicator of the cumulative width of plateaus in relation to the cumulative width of valleys, i.e., of the asymmetry of the height distribution in relation to the middle line. The width and number of plateaus determine the symmetry of the height distribution. Si• is a quantification of the skin profile asymmetry. In the case of the skin surface relief, S•: is negative, as the relief is mainly formed of plateaus (Figures 2, 3). The highest negative Si• value of the abdominal skin surface is situated at the 60-degree angular direction, where the distance across the plateaus' surfaces is at its maximum. The maximum E K value is also obtained at 60 ø, where the height distribution is sharper than in a Gaussian curve. This interpretation confirms a previous study carried out on abdominal sites of 60 subjects (4). The parameter La = (ka), essentially a spacing one (13), shows the maximum distance of spacings between the furrows in the 60 ø angular direction (Figure 7). The value of EK is high when most of the equal heights are closer to each other across a surface (i.e., plateaus) along a direction. This is the case for EK at the 60-degree angular direction of the abdominal skin surface (Figures 2, 6a).
Purchased for the exclusive use of nofirst nolast (unknown)
From: SCC Media Library & Resource Center (library.scconline.org)