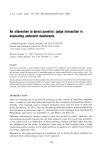
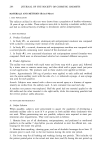
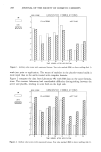
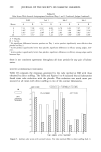
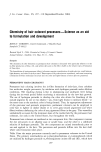
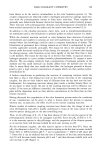
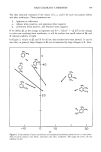
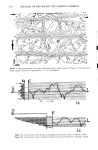
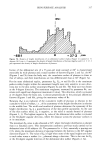
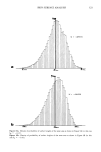
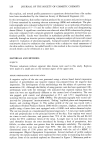
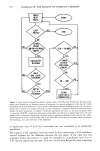
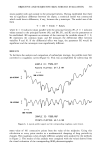
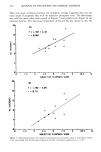
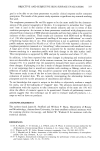
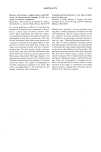
318 JOURNAL OF THE SOCIETY OF COSMETIC CHEMISTS -•.41 2.•1 bocly axis 106 b body 144 25 6 ix i s Figure 6a. Variation of S K and E K parameters according to scan directions (both parameters are without units). Figure 6b. Variation of Rt and g parameters according to scan directions (both parameters are given in p•m).

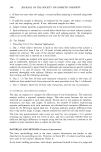
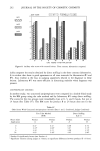
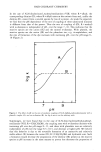
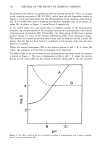
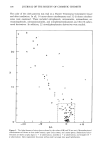
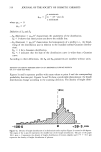
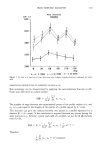
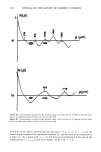
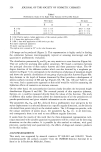
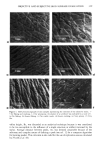
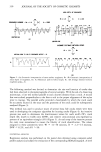
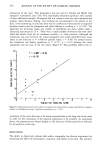
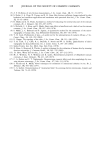
SKIN SURFACE ANALYSIS 319 • L.a 400 HALE SUBJECTS ABDOHEN 350 300 250 200 • --3' .... I I' • 30 [iiO 90 120 150 oleg Figure 7. La (Xa) as a function of scan directions (the O-degree angular direction represents the body axis). HORIZONTAL DISTRIBUTIONS OF ASPERITIES (FIGURES 8a, 8b) Skin anisotropy can be characterized by applying the autocorrelation function to dif- ferent scan directions on a plane surface. N-h R([3) - N 0 '2 z(i) ß z(i + h) i= The number of steps between two experimental points of the profile studies is h, and z(i), z(i + h) are equal to the heights of two points of a profile spaced by h ß steps. This function can give the relation between two points in a profile separated by a distance 13 = (h ß steps). If the correlation is required between two points having the same position (i.e., between a point and itself of a profile), we use the R ([3) formula (with h = 0), N-h R([3 = 0) = N0.2 i= 1 Z(i ) Z(i) -- •-•' 0.2 : 1 Therefore N 1 Z z(i). z(i ) __ = 0.2 (variance). mi=l
Purchased for the exclusive use of nofirst nolast (unknown)
From: SCC Media Library & Resource Center (library.scconline.org)