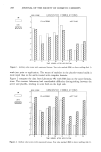
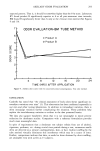
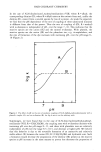
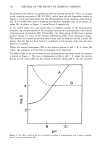
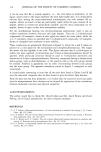
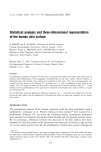
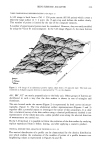
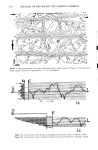
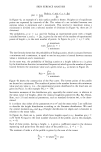
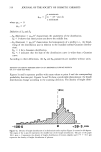
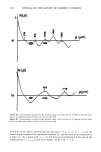
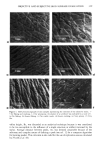
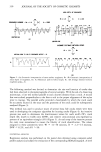
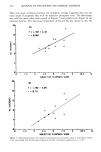
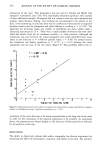
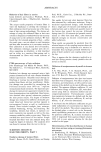
320 JOURNAL OF THE SOCIETY OF COSMETIC CHEMISTS I\ s?o 177o Figure 8a. Autocorrelation function R ([3) obtained using a scan direction of 10 degrees from the body axis on an abdominal positive replica of a 55-year-old male. Figure 8b. Autocorrelation function R (•) obtained using a scan direction of 70 degrees from the body axis on an abdominal positive replica of a 55-year-old male. A profile can be taken, representing one direction x if z•, z2, z 3, z4 ß ß ß Z n are the points' heights separated by equidistant intervals (h), any two such points separated by n steps (i.e., by a quantity [3 = n ß h) will have an autocorrelation if the sum of the height products zi ß Zi+n h is big. For example, for [3 = [3• = 3 h,

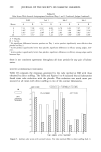
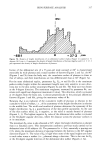
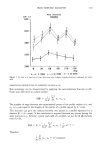
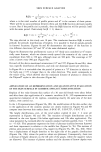
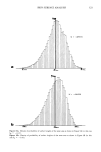
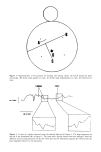
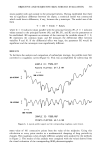
SKIN SURFACE ANALYSIS 321 1 R([3•) - N ' o '2(z• ' Z4 q- Z2 ' Z5 q- ' ' ' Zn-3 ' zn) where n is the total number of profile points and 0 '2 is the variance of these points. There will be no autocorrelation between them and the R([3) function decreases rapidly to zero. But if the profile z(x) is periodic, then the R([3) function will be periodic itself with the same period. Particularly for [3 = 0, there is: R([3 = 0) - N tr 2(z•2 + z22 + ''' zn2) - tr 2- 1 The step selected in this study was 10 •m. The correlation function R([3) is strictly periodic for periodic distributions of heights. It is possible to find all pseudo-periods in furrows' locations. Figures 8a and 8b demonstrate this aspect of the function in two different directions (10 ø and 70 ø of the same abdominal replica). Figure 8a illustrates that profilometric scans at 10 ø (body axis considered at 0 ø) essen- tially meet furrows, which are almost evenly spaced (the summits of the curves are equidistant from 300 to 330 •m, although most are 300 •m). The scannings at 70 ø cross a furrow every 900 •m (Figure 8b). For each of the above mentioned orientations (10 ø and 70 ø) (Figures 8a and 8b), there was a specific distribution of furrows, and only one dominant system per direction. In Figure 8b it is noticeable that the period of points at a 70 ø direction in relation to the body axis (= 0 ø) is longer than in the other direction. This result corresponds to the values of Sic, which showed that the maximum distance of plateaus is crossed by the Talysurf © stylus in this direction (Figure 6a). APPLICATION OF 3-D REPRESENTATION AND QUANTITATIVE EVALUATION OF THE SKIN SURFACE IN COSMETIC EFFICACY SUBSTANTIATION Replicas of the volar forearm skin surface of a 30 year old female were taken before and after three days application of a cosmetic emulsion (0.0). 3-D representation and quantitative evaluation of the replicas, considering exactly the same area of the skin surface, were carried out. In the 3-D representations (Figures 9A, 9B), the modifications of the skin surface due to the application of the cosmetic product are clearly evident (in Figures 9A and 9B compare areas between skin surface lines: A-B//A'-B', C-D//C'D', C-E//C'-E'). The height distributions, p(z), of the total surface studied (4 mm ) 4 mm) are represented in Figures 10a and 10b. The variation of height distributions can be detected in the two figures (10a before application and 10b after application). The value parameter SK increased after the cosmetic product had been applied, from - 0. 369 to -0.426. This parameter expresses the form of plateaus (surfaces between furrows) and their importance in relation to the middle line (Figures 5a, 5b). The increase of plateau areas produced an increase of SK negativity (Figures 9A, 9B, 10a, 10b). There was a displacement of height densities to the right side of the graphic distributions (Figures 10a, 10b), where the positive values are (plateaus). Consequently, there was a decrease of height densities on the left side of the graph, where the negative values are (furrows). The increase of plateau surfaces and the decrease of furrow depths were
Purchased for the exclusive use of nofirst nolast (unknown)
From: SCC Media Library & Resource Center (library.scconline.org)