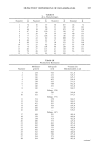
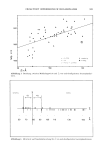
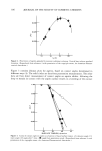
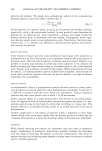
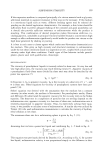
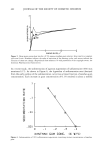
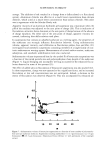
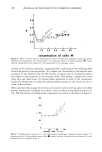
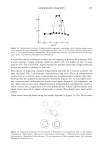
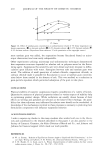
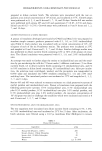
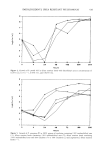
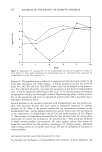
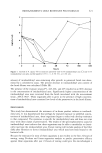
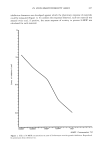
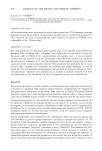
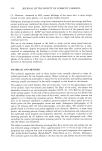
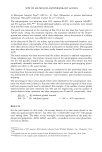
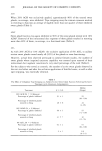
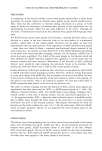
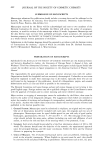
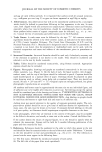
416 JOURNAL OF THE SOCIETY OF COSMETIC CHEMISTS cells. The imidazolidinyl urea content of the flitrate was indirectly estimated by heating the broth in dilute hydrochloric acid to produce formaldehyde which was then reacted with acetylacetone and ammonium acetate to produce diacetyldihydroluitidine which was detected using a colorimetric assay (13,14). The percent decrease in imidazolidinyl urea content was calculated for each sample. RESULTS MINIMUM INHIBITORY CONCENTRATION (MIC) The MIC of imidazolidinyl urea varied for each test organism (Table II). Pseudomonas aeruginosa (ATCC 9027) was effectively killed by 0.25% imidazolidinyl urea. All product isolates were resistant to a minimum of 2.0% imidazolidinyl urea, but strain 495 and RC survived in 5% imidazolidinyl urea. The pattern of resistance for strain 495 was not demonstrated with other preservatives. Strain 495 was effectively killed by 0.1% quaternium 15, 0.1% chlorhexidine gluconate, 0.05% formalin, or 0.2% diazo- lidinyl urea. Diazolidinyl urea was ten times more effective than imidazolidinyl urea against 495. GROWTH PATTERNS IN IMIDAZOLIDINYL UREA BROTH The ATCC organism was effectively killed in 24 hours by all concentrations of imidazo- lidinyl urea (Figure 1). All product isolates were resistant to concentrations of imidazo- lidinyl urea which are higher than those normally found in cosmetics. For example, imidazolidinyl urea at a level of 6% was the only effective cidal concentration for P5 (Figure 2). There was a 24-hour lag time for P5 at the subcidal imidazolidinyl urea concentrations, while strain 495 had a lag time of only 6 hours (Figure 3). Strains 495 and RC grew well in all imidazolidinyl urea concentrations, demonstrating a greater tolerance to imidazolidinyl urea than any of the other product isolates. Organisms 445 and P6 remained viable for more than 7 days only in the solutions containing 0.5 % and 1.0% imidazolidinyl urea. Growth curves were plotted for strain 495 in quaternium 15 and diazolidinyl urea. At 0.1% diazolidinyl urea, the inoculum concentration dropped from 105 cfu/ml to 101 Table II Minimum Inhibitory Concentration (MIC) of Imidazolidinyl Urea for Pseudomonas Species at 35øC Imidazolidinyl urea (%) Test Organisms 8.0 7.0 6.0 5.0 4.0 2.0 1.0 0.5 0.25 Pseudomonas aeruginosa (ATCC 9027) .......... Pseudomonas aeruginosa (P5) .... + + + + + b Pseudomonas putida (P6) ..... + + + + Pseudomonas cepacia (445) ..... + + + + Pseudomonas putida (495) - - - + + + + + + Pseudomonas cepacia (RC) - - -- + + + + + + a Indicates no turbidity after a loopful of the test suspension was transferred to AOAC broth and incubated for 14 days. b Indicates turbidity in broth.

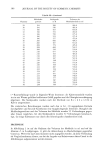
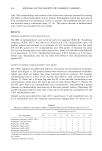
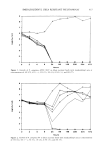
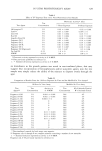
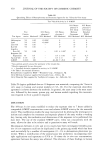
IMIDAZOLIDINYL UREA RESISTANT PSEUDOMONAS 417 o 2 1 i i i 'T • •' • 0 2 4 6 24 96 168 336 $04 67:2 Hours Figure 1. Growth of P. aeruginosa ATCC 9027 in dilute nutrient broth with imidazolidinyl urea at concentrations of: 6% ([]), 4% (--), 2% (0), 1% (/•), 0.5% (x), and 0% (V). 9 8 7 6 5 3 2 1 0 2 4 6 24 96 168 356 504 672 Hours Figure 2. Growth of P. aeruginosa P5 in dilute nutrient broth with imidazolidinyl urea at concentrations of: 6% ([]), 4% (--), 2% (0), 1% (/•), 0.5% (x), and 0% (V).
Purchased for the exclusive use of nofirst nolast (unknown)
From: SCC Media Library & Resource Center (library.scconline.org)