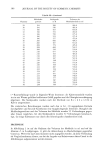
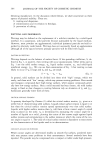
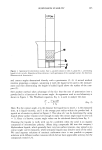
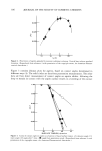
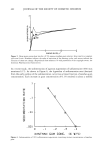
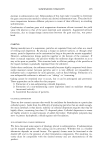
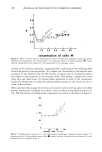
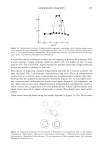
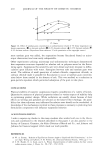
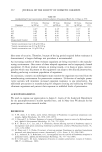
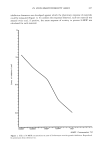
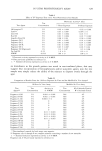
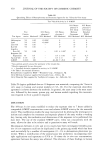
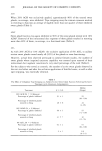
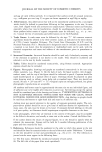
428 JOURNAL OF THE SOCIETY OF COSMETIC CHEMISTS Activity in % 8-MOP = Concentration of 8-MOP giving same size zone of inhibition as test material X lOO Concentration of test material 7-HOUR IN VITRO ASSAY All test procedures were performed as stated above except that UVA exposure time was reduced to seven hours and the distance from the light source to plates was decreased to 10.5 cm with the view of increasing the UVA intensity to achieve an 8-MOP curve comparable to the 18-hour assay. MODIFIED IN VIVO ASSAY The mid-dorsal area of 10 female albino guinea pigs of the Hartley strain (Perfection Breeders, PA), weighing 300-350 grams, was clipped free of hair and 0.2 ml of test materials (refer to Table II for concentrations) was applied over a 1.8-cm diameter circular area and allowed to dry for 30 minutes. One half of the animals was irradiated for one hour at a distance of 31 cm the remainder of the animals was returned to their cages and served as non-irradiated controls. This procedure was performed for two con- secutive days. Animals were evaluated for erythema and edema responses 24 and 48 hours after the second application/exposure and recorded according to Draize (3). Posi- tive phototoxic responses were identified as an increase in dermal irritation of at least one skin grade on the irradiated test site in comparison to the non-irradiated site. RESULTS To increase the efficiency of the method, an investigation was conducted to determine if a decrease in irradiation time could be achieved without compromising the integrity of the quantitative assessment of the assay. Data depicted in Table I for several known phototoxic agents and complex fragrance oil materials indicated that a 7-hour exposure time elicited 8-MOP activity similar to the 18-hour exposure time for test agents listed. As reported previously (2), test results for several complex fragrance oil materials (A, B, C) indicated a difference in response between in vitro and in vivo methods. In view of this discrepancy, an attempt was made to determine if these results could be reproduced by modifying the in vivo assay using multiple applications and exposures to UVA. Table II represents results for 16 test materials of which a total of 7 positive and 9 negative responses were observed in both assays. Several publications have reported on the "quenching" effects of sunscreen agents and UV absorbers to protect against phototoxic reactions in animals and man (4-6). To determine if this phenomenon could be reproduced in the in vitro test system, a coincu- bation study was conducted. Incorporation of 10% benzophenone into the vehicle re- duced or eliminated "low level" phototoxic activity (Table III). The addition of a 10% sunscreen agent to the benzophenone/methanol vehicle appears to enhance the quenching effect but not eliminate the phototoxic potential of stronger test materials. A nonuniform growth around the perimeter of the treated disc was noted for a number of the test materials when the quenching agents were added to the vehicle. However, since

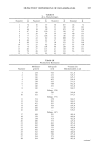
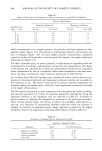
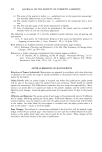
IN VITRO PHOTOTOXICITY ASSAY 429 Table I Effect of UV Exposure Dose on In Vitro Phototoxicity Test Results Test Test Agent Concentration 7 Hours Exposure Phototoxic Activity* After 18 Hours Exposure Heliotropine** 5% 0.02 + 0.004 0.02 + 0.001 Lyral** 5% 0.01 + 0.007 0.004 m 0 Lime Oil 5% 0.01 -+ 0.004 0.01 -+ 0 Rue Oil 5% 0.01 -+ 0.004 0.0l _+ 0.002 Angelica Root Oil 5% 0.08 m 0.04 0.04 m 0.002 Fragrance Oil I 5% 0.01 + 0.001 0.01 + 0.003 Fragrance Oil J 5% 0.01 + 0.006 0.01 + 0.003 Fragrance Oil K 5% 0.01 + 0.001 0.01 m 0.003 Fragrance Oil L 5% 0.03 -+ 0.007 0.03 + 0.02 Bergamot Oil (Expressed) 1% 0.4 + 0.07 0.5 + 0.08 Fig Leaf Oil O. 1% 1.0 -+ 0 0.6 -+ 0 8-MOP 0.01% 100 -+ 0 100 _+ 0 * Phototoxic activity expressed as activity in % 8-MOP. ** Data previously published in reference (2). + = Standard deviations expressed as activity in % 8-MOP. no disturbance in the growth pattern was noted in non-irradiated plates, this may suggest that incorporation of benzophenones and/or sunscreen agents into the test sample may simply reduce the ability of the mixture to disperse evenly through the agar. Table II Comparison of Results From the 18-Hour Exposure In Vitro and the Modified In Vivo Assays* 18-Hour In Vitro Assay Modified In Vivo Assay Test Test Activity in Test # of Animals Positive/ Agent** Concentration % 8-MOP Concentration # of Animals Tested Fragrance A Oil 5% 0.004 _+ 0.001 50% 4/5 Fragrance B Oil 5% 0.002 -+ 0.001 50% 3/5 Fragrance C Oil 5% 0.0001 _+ 0 50% 3/5 Fragrance D Oil 5% 0 50% 0/5 Fragrance E Oil 5 % 0 50% 0/5 Fragrance F Oil 5% 0 50% 0/5 Fragrance G Oil 5% 0 50% 0/5 Fragrance H Oil 5% 0 50% 0/5 Fragrance I Oil 5% 0.01 _+ 0.003 50% 3/5 Fragrance J Oil 5% 0.01 --- 0.003 50% 2/5 Fragrance K Oil 5% 0.01 -+ 0.003 50% 1/5 Fragrance L Oil 5% 0.01 -+ 0.003 50% 2/5 Fragrance M Oil 5% 0 50% 0/5 Fragrance N Oil 5% 0 50% 0/5 Fragrance O Oil 5% 0 50% 0/5 Fragrance P Oil 5% 0 50% 0/5 * Non-irradiated controls for both assays were negative. ** Fragrance oils A through P are complex mixtures containing a number of raw materials. + = Standard deviation expressed as activity in % 8-MOP. Fragrance oils A-H previously reported in reference (2).
Purchased for the exclusive use of nofirst nolast (unknown)
From: SCC Media Library & Resource Center (library.scconline.org)