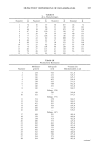
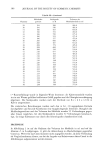
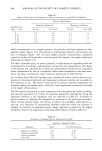
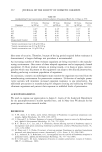
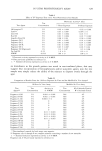
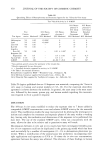
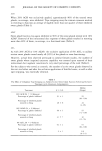
IN VITRO PHOTOTOXICITY ASSAY 429 Table I Effect of UV Exposure Dose on In Vitro Phototoxicity Test Results Test Test Agent Concentration 7 Hours Exposure Phototoxic Activity* After 18 Hours Exposure Heliotropine** 5% 0.02 + 0.004 0.02 + 0.001 Lyral** 5% 0.01 + 0.007 0.004 m 0 Lime Oil 5% 0.01 -+ 0.004 0.01 -+ 0 Rue Oil 5% 0.01 -+ 0.004 0.0l _+ 0.002 Angelica Root Oil 5% 0.08 m 0.04 0.04 m 0.002 Fragrance Oil I 5% 0.01 + 0.001 0.01 + 0.003 Fragrance Oil J 5% 0.01 + 0.006 0.01 + 0.003 Fragrance Oil K 5% 0.01 + 0.001 0.01 m 0.003 Fragrance Oil L 5% 0.03 -+ 0.007 0.03 + 0.02 Bergamot Oil (Expressed) 1% 0.4 + 0.07 0.5 + 0.08 Fig Leaf Oil O. 1% 1.0 -+ 0 0.6 -+ 0 8-MOP 0.01% 100 -+ 0 100 _+ 0 * Phototoxic activity expressed as activity in % 8-MOP. ** Data previously published in reference (2). + = Standard deviations expressed as activity in % 8-MOP. no disturbance in the growth pattern was noted in non-irradiated plates, this may suggest that incorporation of benzophenones and/or sunscreen agents into the test sample may simply reduce the ability of the mixture to disperse evenly through the agar. Table II Comparison of Results From the 18-Hour Exposure In Vitro and the Modified In Vivo Assays* 18-Hour In Vitro Assay Modified In Vivo Assay Test Test Activity in Test # of Animals Positive/ Agent** Concentration % 8-MOP Concentration # of Animals Tested Fragrance A Oil 5% 0.004 _+ 0.001 50% 4/5 Fragrance B Oil 5% 0.002 -+ 0.001 50% 3/5 Fragrance C Oil 5% 0.0001 _+ 0 50% 3/5 Fragrance D Oil 5% 0 50% 0/5 Fragrance E Oil 5 % 0 50% 0/5 Fragrance F Oil 5% 0 50% 0/5 Fragrance G Oil 5% 0 50% 0/5 Fragrance H Oil 5% 0 50% 0/5 Fragrance I Oil 5% 0.01 _+ 0.003 50% 3/5 Fragrance J Oil 5% 0.01 --- 0.003 50% 2/5 Fragrance K Oil 5% 0.01 -+ 0.003 50% 1/5 Fragrance L Oil 5% 0.01 -+ 0.003 50% 2/5 Fragrance M Oil 5% 0 50% 0/5 Fragrance N Oil 5% 0 50% 0/5 Fragrance O Oil 5% 0 50% 0/5 Fragrance P Oil 5% 0 50% 0/5 * Non-irradiated controls for both assays were negative. ** Fragrance oils A through P are complex mixtures containing a number of raw materials. + = Standard deviation expressed as activity in % 8-MOP. Fragrance oils A-H previously reported in reference (2).

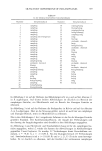
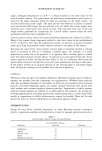
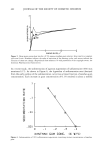
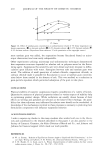
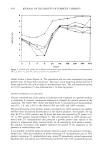
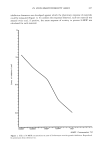
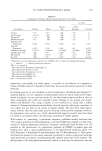
430 JOURNAL OF THE SOCIETY OF COSMETIC CHEMISTS Table III Quenching Effects of Benzophenones and Sunscreen Agents for the 7-Hour In Vitro Assay Test Vehicle/Activity in % 8-MOP Test Agent Test 10% Benzo- Concen- . phenone-2 tration Methanol* 90% Methanol 10% Benzo- phenone-4 90% Methanol 10% Benzo- 10% Benzo- phenone-4 phenone-4 10% Octyl 10% Octyl Methoxy Dimethyl Cinnamate PABA 80% Methanol 80% Methanol Heliotropine 5% 0.02 Lyral 5 % 0.01 Lime Oil 5% 0.01 Rue Oil 5% 0.01 Angelica Root Oil 5% 0.08 Bergamot Oil (Expressed) 1% 0.4 Fig Leaf Oil 0.1% 1.0 8-MOP 0.01% 100 0.008 b 0 0 0 0.008 b 0 0 • 0 - 0 0 • 0 - 0 • 0 a 0 0.01 4- 0.007 03 0 0.4 4- 0.03 0.1 • 0.2 • 0.5 4- o o • o • 40-80 + 28.0 50 • 50 • a Non-uniform growth around the perimeter of the treated disc. b Results represented by one data point. 4- = Standard deviation expressed as activity in % 8-MOP. * See Table I for standard deviations. Benzophenones supplied by BASF--Wyandotte Corp., Parsippany, NJ. Octyl Methoxy Cinnamate supplied by Givauden Corp., Clifton, NJ. Octyl Dimethyl Paba supplied by VanDyke & Company, Inc., Belleville, NJ. Table IV depicts published data on 10 fragrance raw materials, comparing the 7-hour in vitro assay to human and animal models (2,7,8-10). For the materials identified, agreement is shown between the methods. In general, the yeast assay is the most sensi- tive, followed by the mouse, guinea pig, and human models regarding the concentra- tion required to elicit a positive response. DISCUSSION The 18-hour in vitro assay modified to reduce the exposure time to 7 hours yielded a comparable 8-MOP concentration curve and relative 8-MOP activity for the materials tested. This modification makes the assay more practical by allowing the investigator to initiate and complete the treatment and exposure phases of the assay within a working day, leaving only the incubation and observation of the responses to be performed two days later. The use of the standard 8-MOP curve, when run concurrently with the assay, allows the data to be relative and a quantitative assay will result. Discrepancies between in vitro and in vivo results have been investigated whereby posi- tive in vitro responses could not be duplicated in the guinea pig model which has been used successfully by a number of investigators (11-13) to demonstrate phototoxic po- tential. When a modification of the animal assay was performed, encompassing mul- tiple applications and exposures to UVA at 10 times the in vitro test concentration, agreement between the assays was achieved. The relevance of these findings to human
Purchased for the exclusive use of nofirst nolast (unknown)
From: SCC Media Library & Resource Center (library.scconline.org)