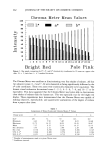
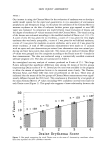
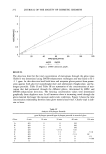
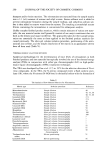
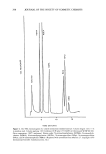
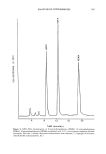
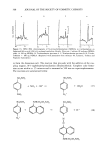
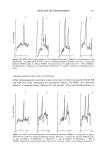
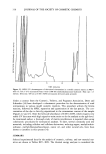
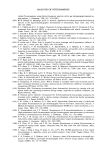
SKIN INJURY ASSESSMENT 261 tized with a combination of ketamine hydrochloride (17) and xylazine (18) administered by intermuscular injection into the lateral thigh and placed in sternal recumbency. Each animal was prepared by attaching six tape assemblies to its back, three on either side of an imaginary line along the dorsal midline of the animal. Tape assemblies were pre- pared by affixing 19-mm squares of double-sided vinyl carpet tape (Devoseal, Devon Tape Corp. Carlstadt, NJ) edge to edge on 1-inch surgical tape (Durapore, Minnesota Mining and Manufacturing Co., St. Paul, MN). A No. 6 corkborer was centered over the removable carpet tape covering and punched through both tapes. The surgical tape was then trimmed to 19-mm width and the free edge attached to a pull tab. After the assemblies were attached to the skin, the protective covering was removed to expose an adhesive surface for fixation of caps. HD vapor challenge was achieved by exposure to HD evaporated within polyethylene caps (No. P799C, Columbia Diagnostics, Inc., Springfield, VA) attached to the tape assemblies. Caps held 14-mm discs of Whatman No. 2 filter paper, fixed 5 mm from the cap rim and wetted with 10 Ixl of HD (USAMRICD Lot No. 2 HD-U42-44-CTF-N-1, 97% pure). This volume of agent was sufficient to uniformly wet the entire surface of the filter paper but not to permit any run-off of liquid agent when the caps were inverted. Loaded caps were stored inverted on glass microscope slides prior to transfer onto animals. Forceps were used to apply caps, remove caps (ending vapor exposure), and to remove tape. The caps were left in place for either 4 or 8 minutes. After removal of the tape the animals were placed in individual cages in a hood. Skin exposed to HD was observed visually and compared to the surrounding normal (non-exposed) skin. At the same time the exposed skin area was also evaluated with the Minolta Chroma Meter. Six replicate Minolta readings were recorded for each exposure site. Evaluations were made at 30, 60, 180, 240, 300, 360, and 1440 (24 hour) minutes post-exposure. After the 24 hour post-exposure observation, the animals were euthanized by anesthetic overdose with halothane. RESULTS AND DISCUSSION PHASE 1 To evaluate the Chroma Meter under ideal conditions, a semi-glossy paper color chart was prepared. The 19 zones on the chart ranged in color from pale pink to bright red. Of the various CIE tristimulus color systems available on the Chroma Meter, we used the L*, a*, b* chromaticity coordinates. This color coordinate system most closely represented human sensitivity to color. An equal distance in this system was approxi- mately an equal difference in perceived color by humans. The results of the Chroma Meter measurements are summarized in the bar graph of Figure 1. This bar graph compared the absolute L*, a*, b* chromaticity coordinates. The L* whiteness coordi- nate was observed to decrease by 32% in going from pale pink to bright red on the color chart. The standard deviation error bars at the top of the bars were too small to be visible. This trend was consistent with the approximate perceived human response. The a* color coordinate was observed to increase by 180%, while the b* color coordinate increased by 270% over the same color interval. Since the a* color coordinate was directly related to the degree of color redness, it was the most appropriate parameter to use for evaluating erythema.

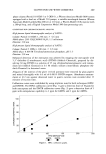
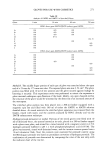
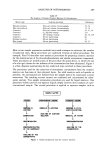
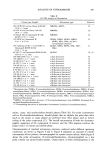
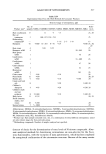
262 JOURNAL OF THE SOCIETY OF COSMETIC CHEMISTS loo Chroma Meter Mean Values ß a* kX%%-'q b* 80 ß 1 g 3 4 5 õ ? 8 9 1O 11 lg 13 14 15 16 17 18 19 Bright Red Pale Pink Figure 1. Bar graph comparing the L*, a*, and b* chromaticity coordinates for 19 zones on a paper color chart. N = 5' error bars = - 1 standard deviation. The Chroma Meter was excellent at discriminating very fine shades of redness. All but two adjacent zones (1-2 and 7-8) were measured as being significantly different by the a* color coordinate. These two zones were statistically measured to be equivalent. The human visual evaluation determined zones 1-2-3, 4-5-6, 7-8, and 16-17 to be equivalent. This data suggested that the Chroma Meter was better able to discriminate close shades of redness than the human eye. This was especially true for the bright red shades. These experiments have demonstrated that the Chroma Meter was capable of making objective, reproducible, and quantitative assessments of the degree of redness from a paper color chart. Table I Comparison of Draize Scores and Chroma Meter a* Values Draize score 0 1 2 3 4 Size a 129. 72. 97. 123. 167. Minimum 4.42 5.50 5.85 8.65 10.68 Maximum 11.75 14.12 19.23 19.45 20.07 Mean 7.37 9.15 12.14 14.17 15.74 Std. deviation 1.54 2.12 2.80 2.28 1.88 Std. error 0.136 0.250 0.284 0.206 0.145 95% C.I. b 0.266 0.489 0.556 0.403 0.284 99% C.I? 0.351 0.644 0.732 0.530 0.374 Number of measurements made at a given Draize score. Confidence interval.
Purchased for the exclusive use of nofirst nolast (unknown)
From: SCC Media Library & Resource Center (library.scconline.org)