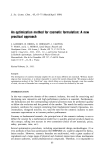
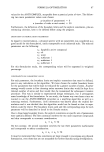
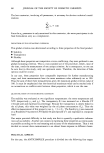
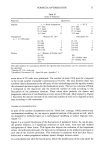
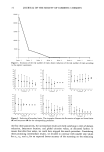
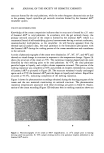
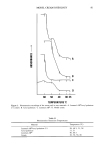
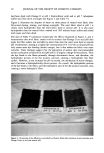
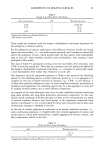
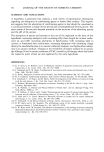
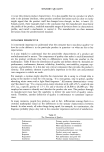
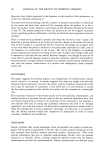
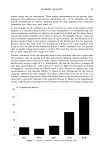
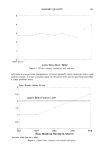
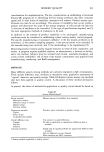
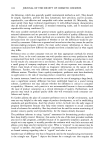
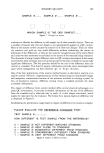
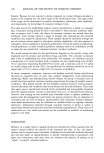
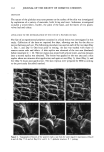
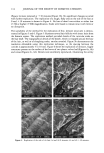
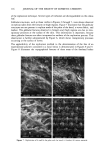
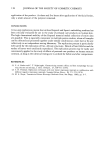
SENSORY QUALITY 99 human judges and not instruments. These sensory measurements do not provide infor- mation on the preferences, expectations, experiences, etc., of the consumer, but they provide measurement of sensory attributes using the same apparatus that consumers themselves use--their eyes, ears, noses, etc. A clear example of the usefulness of a sensory function as a part of the quality control program at a manufacturing facility is in crisis management. In troubleshooting con- sumer complaints, problems can often be uncovered and rectified quickly when there is sensory information available on the batch in question. For example, Figure ! shows the rise in consumer complaints for a moisturizer in a given month. The identification of the batches involved leads to the sensory evaluation of the batches and the raw materials. Results indicate that some of the raw materials are drifting out of control and have been doing so over the past several shipments. Figure 2 shows, retrospectively, the gradual shift in quality ratings from month to month. The solid line moving downward from left to right represents this change over time. Further, evaluation of the raw materials leads to the conclusion that one in particular, the sunscreen, may be causing both odor and texture problems. Sensory skinfeel eval- uations indicate that it may be too tacky. Figure 3 shows that tackiness scores of recent batches have reached a high of 2.5. Additionally, the last two lots have a stronger off odor than usual (Figure 4), with scores of 3.5 and 4.0. Based on the results of sensory investigation, manufacturing and R&D make a joint decision to tighten the odor specifications on this material (Figure 5), based on new information on the level of consumer tolerance for odor changes. The upper control limit will now be set at 2. O. Further, laboratory experiments show that modification of the formulation results in a reduction in perceived tackiness of the sunscreen (Figure 6). Based on the experimental results, a specification limiting the level of sunscreen tackiness to a sensory scaling value # Complaints/Month 30 25 • 207 i lO7 I i 51 OCT NOV DEC JAN Figure t. Consumer complaints, October 1992-February 1993. FEB

100 JOURNAL OF THE SOCIETY OF COSMETIC CHEMISTS MEAN RATING 4 lots Figure 2. Moisturizer quality drift: sensory difference ratings. of 1.5 is established (Figure 6), and the procedure to monitor it is a sensory skinfeel evaluation. While the availability and use of sensory methods facilitated the problem solving, it is vlean Scores 2.5 1.5 0.5 i L I OCT Oct/1992-Feb/1998 NOV DEC JAN FEB Figure 3. Tackiness ratings.
Purchased for the exclusive use of nofirst nolast (unknown)
From: SCC Media Library & Resource Center (library.scconline.org)