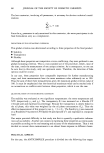
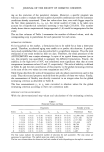
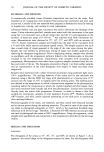
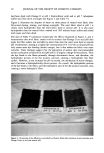
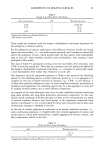
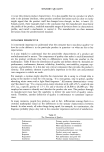
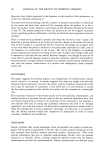
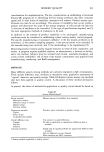
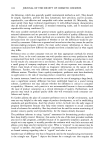
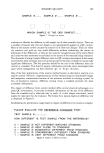
SENSORY QUALITY 105 SAMPLE # .... SAMPLE # .... SAMPLE #___ WHICH SAMPLE IS THE ODD SAMPLE? .... Figure 7. Triangle test format. evaluator to identify the different or odd sample out of three possible choices. There are a number of reasons why this test design is not appropriately applied in a QC context. Most of the reasons revolve around the sensitivity of these test designs. They are either too sensitive and pick up very small differences without elaborating the nature or dimension of the differences, or they are not sensitive enough because of the order effects and carryover that sometimes occur based on the nature of the material being evaluated. The downside of using triangle difference tests in a QC testing environment is that many more batches than necessary may end up being rejected because of small but statistically significant differences. The key question should be the size of the difference from the control or standard. This kind of sensory information provides more meaningful data upon which management can base informed "go" or "no-go" decisions. One of the best applications of the sensory method known as descriptive analysis is in quality control. However, implementation of this method requires considerable budget and manpower commitments because of the resources involved in training a panel. In lieu of descriptive analysis, difference testing versus a standard provides the most actionable information. The degree of difference from control method offers several practical advantages in a plant QC environment. It provides actionable information on the size of the difference from the standard and is relatively easy to teach. It is also simply structured, which makes the task easier for the evaluator. The format for a typical degree-of-difference test is displayed in Figure 8. Establishing the specification range based on degree-of-difference test results is straight- PLEASE EVALUATE THE REFERENCE STANDARD FIRST. TEST SAMPLE # HOW DIFFERENT IS TEST SAMPLE FROM THE REFERENCE? 5 -- SAMPLE IS NOT DIFFERENT/MATCHES STANDARD 4 - SAMPLE IS VERY CLOSE TO STANDARD 3 -- SAMPLE IS MODERATELY DIFFERENT FROM STANDARD 2 -- SAMPLE IS CONSIDERABLY DIFFERENT FROM STANDARD I = SAMPLE IS VERY DIFFERENT FROM STANDARD Figure 8. Degree of difference format.

106 JOURNAL OF THE SOCIETY OF COSMETIC CHEMISTS forward. Because the test material is always compared to a target reference standard, a match to the standard sets the lower range of the specification limit. The upper limit of the range can be determined by product development, marketing, plant capability, and importantly, by knowledge of consumer tolerance levels. The ideal process for establishing product sensory specifications is based on consumer data. Consumer testing should be used to determine 1) which product attributes influ- ence acceptance and 2) what the limits of consumer tolerance are around these key attributes. Such testing requires a range of samples that demonstrate the potential variability that might be experienced. These samples should be identified through the use of in-house sensory panels or descriptive analysis capabilities, and then exposed to consumers. Action standards or minimum performance criteria for sample overall rating, overall preference, or other overall acceptability measures need to be established, as well as values for any preselected "consumer sensitive" product attributes. The actual numerical value for the specifications depends on the specific rating scale employed and the product and attributes being controlled. The consumer acceptance data is key to establishing this value realistically. For example, if a tackiness score for a moisturizer is 2.0 and correlates with a consumer-use test overall rating score of 80% (% of consumers responding Excellent/Very Good), and a tackiness score of 3.0 yields an overall rating score of only 50%, the specification for tackiness should be set at an upper limit of 2.0 to insure a high level of consumer acceptability. In many companies, manpower resources and budgets preclude basing specification decisions on consumer data. In such cases, product management teams representing marketing, R&D, and manufacturing should evaluate the group of samples (such as would have been used for consumer testing) representing the range of possible product variability. They should identify the key probable consumer-sensitive sensory parame- ters and determine the variability that occurs around the selected attributes. They must then agree upon a specification beyond which unintended and unacceptable deviations from the original product concept or description will occur. It should become obvious, however, that relying on this method may eventually result in quality problems. It assumes that the management team knows the sensory properties that are important to consumers and the level of product reproducibility that consumers demand. Manage- ment-based specifications may be confirmed or modified based on ongoing consumer experience. Information obtained through consumer hotlines or letters is useful in monitoring whether specifications have been established appropriately. These sources of information are very useful and should not be overlooked as methods of monitoring quality in the field. CONCLUSION Reliance on a single expert to qualify production materials for release assumes that the expert's opinion reflects the opinion of all consumers and that, in fact, the expert's opinion can be imposed upon consumers. Evaluation of the alternate methods discussed and selection based on appropriateness in specific manufacturing circumstances will begin the evolutionary path away from the industry-wide practice of relying on an "expert" to predict consumer behavior.
Purchased for the exclusive use of nofirst nolast (unknown)
From: SCC Media Library & Resource Center (library.scconline.org)