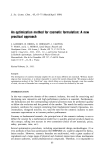
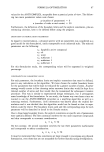
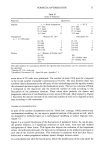
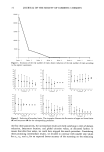
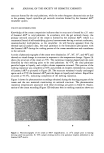
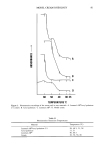
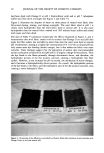
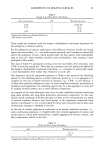
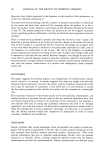
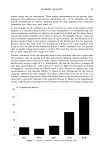
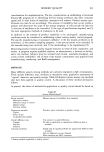
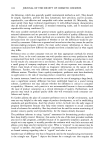
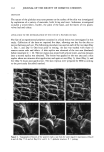
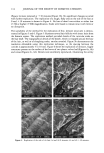
72 JOURNAL OF THE SOCIETY OF COSMETIC CHEMISTS 250000 200000 150000 100000 50000 I I 1 Series 1 Series 2 Series 3 Series 4 Series 5 Series 6 Series 7 Series 8 Figure 1. Evolution of the real number of trials: drastic reduction of the real number of trials according to the explicit constraints. i i t i i i i Parameter xl •o lO s o S2 sa S7 S• Parameter x2 i • i i t i i i sa sa sn as s• s? s• Parameler x3 m (m ß ß ß Parameter x4 Parameter x5 s? s• 14 lO 4 Sl sa_ s? Parameler x6 Figure 2. Evolution of boundary limits. The six graphs illustrate the fluctuation of upper and lower limits (©) and barycenter (m) for the corresponding parameter. the first three parameters, the intermediate results are really satisfying in term of domain reduction, barycenter location, and global criterion values, as discussed further. It means that after four series, we could have stopped the search procedure. Considering these promising intermediate results, we decided to continue with smaller step values for x•, x 2, and x 3 for an expected better accuracy of the screening on the remaining

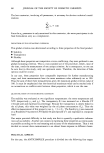
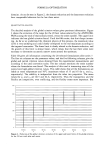
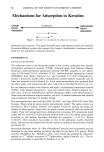
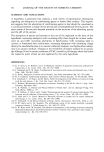
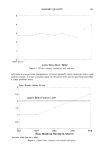
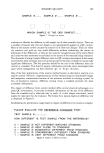
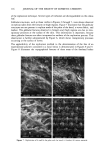
FORMULA OPTIMIZATION 73 domains. As can be seen in Figure 2, the domain reduction and the barycenter evolution have comparable behaviors for the last three series. QUANTITATIVE ANALYSIS The detailed analysis of the global criterion values gives pertinent information. Figure 3 shows the evolution of the range for the 20 best values selected by the ANTICOM- PLEX among the total of trials already tested, versus the series number. The upper limit indicates the best global criterion found. Until the fifth series, this limit keeps increas- ing. As far as we understand the chemical physics of this process, the maximum value (216) is very satisfying and could closely correspond to the real maximum accoMing to the imposed constraints. The lower limit is closely related to the domain reduction, and the growth of this limit is almost linear, which means that the last three series were necessary to determine accurately narrow zones around the optimum. Table III gives all information concerning the 20 selected formulations after series 7. The first six columns are the parameter values, and the five following columns give the global and partial criterion values obtained from the experimental measurements and according to the used conversion scales. The last column mentions the series number where the formulation was found. The analysis of this total is interesting since all the points have high global criterion values. This table shows that all the formulations are stable at room temperature and 50øC (maximum values of 35 and 65 for y• and Y2, respectively). The stability is independent from the other two properties. The mean values for Y3 and Y4 are 40.5 and 64.6, respectively. Thus the transparency and the fluidity are competitive, even conflicting, and the fluidity seems more important. But 250 200 150 100 Series Series Series Series Series Series Series 1 .2 3 4 5 6 7 Figure 3. Evolution of the global criterion: evolution of the upper and lower limits of the global criterion for the 20 best trials after each series.
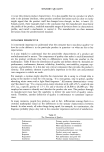
Purchased for the exclusive use of nofirst nolast (unknown)
From: SCC Media Library & Resource Center (library.scconline.org)