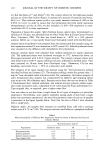
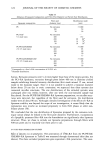
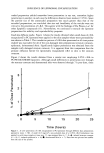
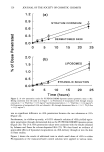
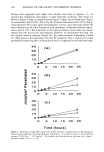
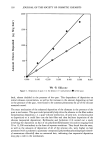
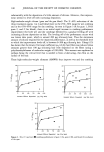
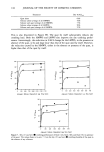
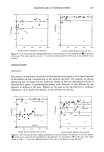
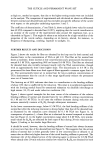
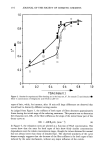
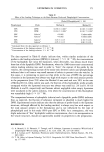
THE CUTICLE AND PERMANENT WAVE SET 153 at high set, marked as squares, that due to the higher setting strains were not included in the analysis. The comparison of experimental and calculated set shows no differences between normal and alescaled hairs and thus excludes any specific influence of the cuticle with respect to the principles underlying equations 3 and 5. The coefficient of determination, r 2 (see Table I), shows a slightly lower value for normal hair (0.959) compared to descaled hair (0.987), implying that the cuticle contributes to an increase of the scatter of the experimental data around the regression line, as is observable in Figure 1. This might be taken as an indication for a high variability of the properties of the cuticle surface, depending on its history, related, for instance, to frequency of shampooing, combing, exposure to sunlight, etc. FURTHER RESULTS AND DISCUSSION Figure 2 shows the results for fiber set obtained by the loop test for both normal and descaled hairs vs the concentration of TGA at pH 9.0. The fiber set for normal hair shows a moderate, linear increase at low concentrations and a pronounced discontinuity around 0.5 M TGA, approaching 90% set beyond 0.6 M TGA. The fiber set obtained for descaled hairs also initially increases linearly with the TGA concentration, though with an approximately three times higher slope. The discontinuity at 0.5 M is less pronounced for these fibers since both types of fibers approach a common upper limit of set. The systematically lower set in normal hair for low-to-medium concentrations of TGA demonstrates that the cuticle in that range significantly reduces the permanent wave set of human hair. The limiting set of 90% indicates that there is a contribution to the bending stiffness of about 10% that is unaffected by the reduction. This value is in satisfactory agreement with the limiting moduli found for extensional relaxation via disulfide interchange at high strains (14,15) and under reductive conditions (16). Figure 3 shows typical examples for the time course of the relaxation of the relative bending stiffness of normal and alescaled hairs for two different setting concentrations (0.3 M and 0.6 M TGA). In all cases the stiffness decreases during reduction and remains essentially constant at Bre/B o through subsequent treatments. In the lower concentration range, below 0.5 M TGA, the final bending stiffness of the normal hair after the reducing treatment is always higher than that of the descaled hair, as illustrated by the relaxation curve obtained for 0.3 M TGA (see Figure 3). In consequence of equation 3, a lower fiber set is obtained for normal compared to descaled hair (see Figure 2). In the higher concentration range above 0.6 M TGA, very similar, small values for Bre/B o are obtained for both types of hair during 20-min reduction (see Figure 3) leading to the similar large-fiber sets. It should be noted, however, that the bending stiffness of normal hair always decreases at a lower rate than that of the descaled hair (see Figure 3). This suggests that the setting ability of normal hair is either generally lower in low concentrations or delayed to an extent that an effectively higher fraction of the initial bending stiffness is preserved. The dominant role of the delayed action of the reducing agent is obvious for 0.6 M TGA where already after 20-min reduction similar low values for B•e/B o are obtained for both

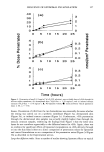
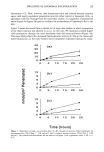
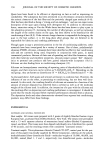
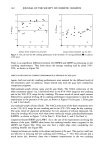
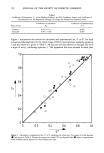
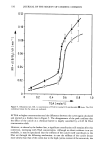
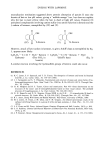
154 JOURNAL OF THE SOCIETY OF COSMETIC CHEMISTS 1.0 0,8 0.6 0.4 0.2 • I i I I I I I I 0 0.2 0.4 0.6 0.8 1.0 TGA [mole/l] Figure 2. Results for experimental fiber bending set in the loop test, S e, for normal (O) and descaled (O) fibers vs concentration of thioglycolic acid (TGA) at pH 9.0. types of hair, while, for instance, after 10 min still large differences are observed that would lead to distinctly different setting results. As judged from Figure 3, the stiffness of both types of fibers decreases approximately linear during the initial stage of the reducing treatment. This permits one to determine the relaxation rate, RR, of the fiber stiffness as the slope of the initial linear part of the decay curve as: RR = d(B/Bo)/dt , [min- •] (6) In Figure 4, the relaxation rates are plotted as a function of TGA concentration. The curves show that the rates for both types of hair show fairly similar concentration dependences over the whole concentration range, though the values obtained for normal hair are always lower than those of descaled hair. The observed similarity of the curve shapes strongly suggests that the decrease of the fiber stiffness is for both types of hair induced by the same mechanism, without any major influence of the cuticle.
Purchased for the exclusive use of nofirst nolast (unknown)
From: SCC Media Library & Resource Center (library.scconline.org)