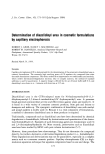
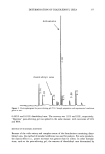
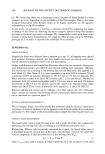
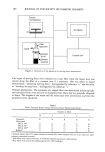
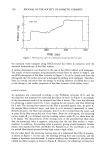
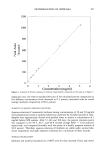
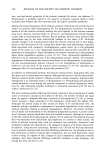
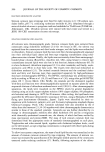
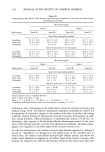
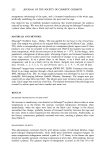
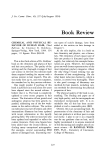
DETERMINATION OF IMIDUREA 197 1200 10oo 800 600 400 200 0 1 2 3 4 5 Concentration (mg/ml) Figure 2. Linearity of detector response to imidurea. Experimental conditions are the same as in Figure 1. migration time, the relative standard deviation of the calculated percent composition at five different concentration levels decreased to 0.2 percent, associated with an overall average imidurea composition of 96.6 percent. STABILITY OF AQUEOUS IMIDUREA SOLUTIONS Aqueous solutions of commercial imidurea having concentrations of 10 and 50 mg/mL were prepared and stored at ambient laboratory conditions for extended periods of time. Samples were appropriately diluted with purified water to achieve a concentration of 1 mg/mL before CZE analysis. After 51, 86, and 106 days, the percent imidurea purity was computed to be 96.5, 96.7, and 96.8 (overall average RSD = 0.18 percent), respectively, and compared favorably with the purity of a freshly prepared solution of 96.6 percent. Therefore, aqueous solutions of imidurea are stable under normal labo- ratory temperature and light exposure conditions for a minimum of three months. THERMAL DEGRADATION Imidurea raw material was placed in a 180øC oven for time intervals of four and twelve

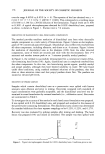
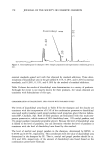
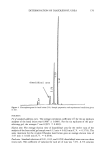
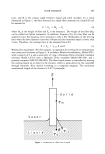
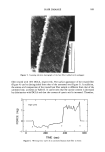
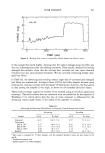
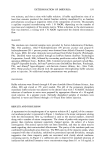
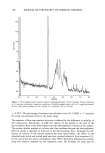
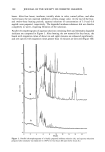
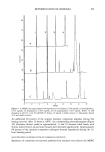
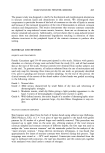
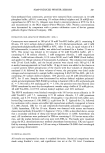
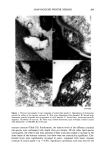
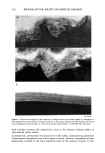
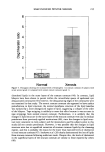
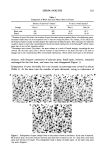
198 JOURNAL OF THE SOCIETY OF COSMETIC CHEMISTS hours. After four hours, imidurea, initially white in color, turned yellow, and after twelve hours the raw material exhibited a yellow-orange color. At the end of the four- and twelve-hour heating periods, aqueous solutions of concentration of 5.0 and 6.0 mg/mL were prepared, respectively. The degraded imidurea substance did not dissolve completely in water, requiring filtration of the solutions. Parallel electropherograms of aqueous solutions containing fresh and thermally degraded imidurea are compared in Figure 3. After heating the raw material for four hours, the bands with migration times of about six and eight minutes are enhanced significantly, and new species with migration times greater than 12 minutes are detected (Figure 3B). 14. A 0 2 • 6 8 10 1'2 14 16 18 Minutes Figure 3. Parallel electropherograms of a freshly prepared imidurea solution (A), and aqueous solutions prepared after imidurea was subjected to 180øC for four hours (B) and twelve hours (C).
Purchased for the exclusive use of nofirst nolast (unknown)
From: SCC Media Library & Resource Center (library.scconline.org)