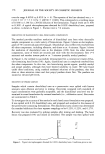
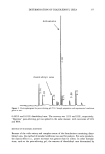
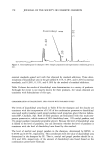
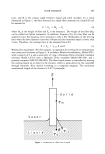
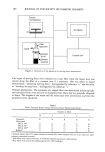
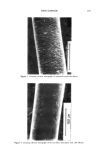
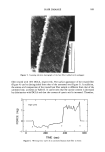
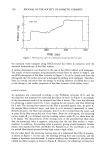
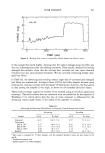
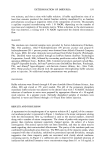
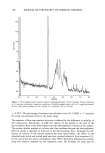
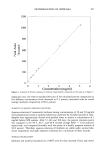
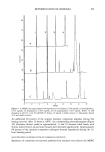
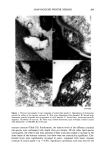
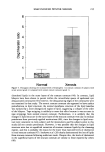
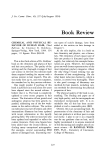
DETERMINATION OF IMIDUREA 195 two minutes, and then a rinse with buffer solution. A buffer equilibration time of at least four minutes produced the desired baseline stability manifested by no baseline perturbations occurring at migration times of the components of interest. Occasionally a capillary required reconditioning with 1 N NaOH, depending on the number of injections and complexity of the sample matrix. When a decrease in the electroosmotic flow was observed, a rinsing with 1 N NaOH regenerated the desired electroosmotic flow. REAGENTS The imidurea raw material samples were provided by Sutton Laboratories (Chatham, NJ). The parabens, ethyl-4-hydroxybenzoate (99 percent purity) and propyl-4- hydroxybenzoate (99 + percent purity) were obtained from Aldrich Chemical Company (St. Louis, MO). All other chemicals were purchased from Fisher Scientific (Pittsburgh, PA). Distilled water was purified through an IonPure System (IonPure Technologies Corporation, Lowell, MA), followed by a secondary purification with a Milli-Q UV Plus apparatus (Millipore Corp., Bedford, MA). Commercial products analyzed include Mas- sengill © disposable douche, bell-mai © powder scent (SmithKline Beecham, Pittsburgh, PA), and Almay © hypo-allergenic, anti-bacteria cleanser (Almay, Inc., New York, NY). These products were diluted with the appropriate electrophoresis buffer solution prior to injection. No additional sample pretreatment was performed. PROCEDURES Buffer solutions were filtered through 0.45-ptm Acrodisk filters (Gelman Science, Ann Arbor, MI) and stored at 4øC until needed. The pH of the potassium phosphate monobasic buffer solution was adjusted to the desired value with 1 N NaOH. Standard solutions of imidurea in water were prepared by appropriate dilution of a 10-mg/mL stock solution. In a separate study, thermally degradated samples of imidurea were dissolved in water and filtered through a 0.45-ptm filter before injection. RESULTS AND DISCUSSION A representative electropherogram of an aqueous solution (8.2 mg/mL) of the commer- cial imidurea product is presented in Figure 1. Imidurea is the major component eluting with the electroosmotic flow (t o) (methanol is used as the neutral marker), observed along with a number of minor components. The cluster of peaks with migration times greater than imidurea represent negatively charged species, the subject of a future investigation. The anionic species have not been identified, and thus no claim may be made regarding their antimicrobial effectiveness. The purity of the imidurea peak was confirmed by photodiode array detection. The PDA spectra of the impurity peaks, when compared with that of imidurea, exhibited no pronounced spectral deviations, strongly suggestive that these impurity peaks are associated with closely related imidurea- containing species. In Figure 2 a calibration plot is depicted for standard solutions of imidurea that exhibited linerarity over a concentration range from 0.1 to 5.0 mg/mL (r

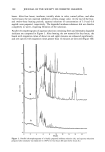
196 JOURNAL OF THE SOCIETY OF COSMETIC CHEMISTS 3.0 2.5 2.0 E 1.5 1.0 0.5 0.0 -0.5 0.0 1.0 2:0 3'.0 4 0 5:0 6'.0 7'.0 8'.0 Minutes Figure 1. Electropherogram of aqueous solution containing Germall ! !5 (8.2 mg/mL). Major component at 3.3 minutes is imidurea. Separation conditions: 10 mM phosphate buffer, pH of 6.1 applied potential, 30 KV fused silica capillary (50 cm, 50-•m i.d.) detection, UV at 190 nm. = 0.997). The percentage of imidurea was calculated to be 96.5 (RSD = 2.1 percent) for seven concentration levels in the linear range. The response of flow-rate sensitive detectors is affected by the difference in mobility of the components. Specifically, in CZE the velocity of the analyte is the sum of the electroosmotic flow of the bulk solution and the electrophoretic velocity of the analyte. The anionic species migrate at a slower rate than imidurea because the electrophoretic flow for anions is opposite in direction to the electroosmotic flow. Although the dif- ference in velocity of the various analytes has been noted before, the effects in the observed peak width and overall peak area have received relatively little attention (13). In the case of percent purity calculations, these effects have been addressed by normal- izing the detector response by the migration time. By dividing the peak area by
Purchased for the exclusive use of nofirst nolast (unknown)
From: SCC Media Library & Resource Center (library.scconline.org)