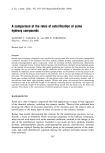
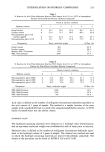
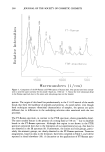
FT-RAMAN SPECTROSCOPY 259 min. The active ingredient in this product is ammonium thioglycolate. The neutral- ization step was omitted in order to obtain the spectrum of reduced hair keratin. Following reduction, the hair was rinsed and then dried under nitrogen. The dry tresses were stored in an evacuated polyethylene bag prior to spectral measurements, to prevent atmospheric oxidation of the reduced disulfide bonds. Hair photodamage was performed in a solar simulator (Atlas Ci35A, simulating average Miami sunlight) for 165 h at 50øC and 48% RH. This is equivalent to 21.2 kJ/cm 2 of visible light and 2.6 kJ/cm 2 of total UV light. FT-Raman measurements were performed on either a Nicolet 910 dedicated instrument using 1064 nm light from a Nd 3 +' YAG laser or on a Mattson Research Series Raman accessory/spectrometer system. A strand of hair (ca. 500 fibers) was inserted in an NMR tube mounted in the sample compartment, and the data were collected at 180 degrees at a power level of -- 100 mW and 4 cm- 1 resolution. The nominal laser beam diameter is 1 mm at the sample, which, assuming a typical hair diameter of 70 Ixm, will probe at least ten fibers. It should be noted that the spectra are internally normalized with respect to protein backbone bands, which are assumed to be relatively constant. This removes the likelihood of errors associated with probing different amounts of fibers every time they are inserted into the sample holder. For quantitative work, in view of the large fiber-to-fiber variation, it is desirable to obtain multiple runs on the same set of fibers, repositioning them each time, to obtain an average representative spectrum. Typical data collection time was 15 min. The spectra were then corrected for instrumental response. The relatively long wavelength of excitation provides information on the fiber bulk, at least for unpigmented fibers, since the strong laser light penetrates through the fiber due to weak absorption by hair proteins. FTIR measurements were made on an IR-Plan microscope (Spectra-Tech Inc., Stamford, CT) connected to a Perkin Elmer 1760-X FTIR spectrometer. Typically a "-0.5 mm long hair piece is pressed between two hardened steel plates at 1800 psi for 1 min and then transferred to the Ix-plan sample holder using 2 mm NaC1 windows. A small crystal of KBr, also included in the cell along with the sample, served as the background against which the sample spectrum was measured using an MCT detector. This latter step is necessary to eliminate interference fringes. In this experimental arrangement the --1 lower end of the spectrum is limited to ca. 700 cm FTIR data were transferred from the Model 7000 computer (Perkin-Elmer) using an RD-7 program (Silvermine Resources Inc. Wilton, CT) into a PC-readable format. These data, as well as the FT-Raman data, were then converted to the JCAMP format. The converted data were imported into Lab Calc (Galactic software) for spectral manip- ulations and printing. RESULTS AND DISCUSSION The vibrational spectra of human hair have been presented in Figure 1. The FT-Raman spectrum was measured on a fiber bundle, while the FTIR data were obtained from a single fiber in the microscope. For a meaningful comparison, the spectra have been normalized such that the amide I band (ca. 1660 cm- 1) is equal in intensity in the two

260 JOURNAL OF THE SOCIETY OF COSMETIC CHEMISTS FT-Rarnen cq FTIR obsorbonce I I I 1500 1000 500 Wavenumbers (1/cm) Figure 1. Comparison of the FT-Raman and FTIR spectra of human hair. The spectra have been normal- ized to yield the same intensity for the amide I bands (ca. 1660 cm- •). Notice the rich vibrational detail in the Raman spectrum due to the amino acid side groups (see text for details). spectra. The origin of this band lies predominantly in the C • O stretch of the amide bonds that form the backbone of peptides and proteins. As noted earlier, even though both techniques measure vibrational characteristics of samples, the spectra are quite different due to differences in the underlying selection rules associated with the two processes. The FT-Raman spectrum, in contrast to the FTIR spectrum, shows remarkable detail. The most notable feature is the presence of a strong band at 510 cm- a due to disulfide bonds in the FT-Raman spectrum. Although this region is not shown in the FTIR spectrum presented here due to the limitation of our experimental set-up, this band is not observed in the IR spectrum (6). Furthermore, the amino acid side groups, partic- ularly the aromatic groups, are clearly observed in the FT-Raman spectrum. Tentative assignments, based on data in the literature, have been compiled in Table I, and will be reported in detail elsewhere (18). A discussion on the applications of FT-Raman spec-
Purchased for the exclusive use of nofirst nolast (unknown)
From: SCC Media Library & Resource Center (library.scconline.org)