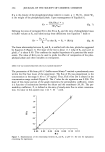
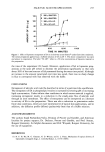
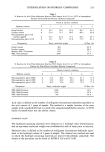
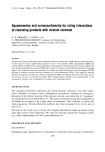
SQUAMOMETRY AND CORNEOSURFAMETRY 273 L ß 60 50 40 30 20 10 10 20 30 40 50 60 Chrorna C* Figure 2. Corneosurfametry with the soap So-A (I) diluted at 1% (A) and 5% (B) and with the Syndet Sy-B (&) diluted at 1% (C) and 5% (D). Successive evaluations were made after 2, 8, 24, and 48 hours. Both the concentration of the test products and the duration of the test influence the colorimetric parameters L** and Chroma C**. The inverse relationship between L** and Chroma C** is valid only when L** is over 45. apparently corresponded to a normal stratum corneum, inter-individual variations in D-SQMI (V ranging 106--749%) were larger than in CSMI (V ranging 7-42%) for all tested cleansing agents. A positive linear correlation (r = .93, p 0.001) was evidenced between the CSMI corresponding to 1% and 5% solutions of cleansing agents. This was true for both the means and medians of these indices (Figure 3). Three groups of products were identified by CSMI determinations. The only products with CSMI lower than 20 were Tween 20 and CAPB. Another group of five cleansing agents with CSMI ranging from 20 to 40 included So-A, So-D, So-E, Sy-B, and Sy-D. The next group with increasing CSMI ranking included Sy-A, SLS, So-C, Sy-C, and So-B. Significant differences were found in CSMI values between each product belong- ing to one group and those of the other groups. No difference was found between products within each group. Means and medians of CSMI for 1% solutions were lower or about the same than those of 5% solutions. No correlation was found between D-SQMI and CSMI of products at dilutions of 1% (r = 0.48) and 5 % (r = 0.49) (Figure 4). At the 5 % dilution, all products, except So-A

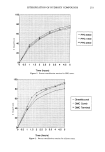
274 JOURNAL OF THE SOCIETY OF COSMETIC CHEMISTS CSMI-1% 60 50 40 30 20 10 0 10 20 30 40 50 60 CSMI-5 % Figure 3. Comparison of corneosurfametry index (CSMI) with reference products Tween 20 and CAPB ('k), SLS (•), soaps (I), and syndets (&), diluted at 1% and 5%. A significant positive linear relationship is evidenced. and So-E, had D-SQMI values in the range defined by the two mild reference surfactants (Tween 20 and CAPB) and SLS. When considering CSMI, most products were in the range bounded by the reference surfactants. Two soaps (So-B and So-C) and one syndet (Sy-C) were at the upper CSMI limit without reaching significant difference with the SLS rating. DISCUSSION The preliminary evaluations were conducted to improve and/or to confirm previous methodological procedures involving squamometry (4) and corneosurfametry (5). In the past, the evaluation of the amount of stratum corneum collected by D-Squames was made by light transmission (7), colorimetry (4), or image analysis (8). In the present study we compared measurements of alterations of light transmission by unstained stratum corneum with colorimetry of PMS-stained material. This latter way of mea- surement, called squamometry, appeared to be the most sensitive, although propor- tional to the changes related to light scattering and reflection by unstained corneocytes. We found that a seemingly normal stratum corneum of the volar aspect of the forearm was characterized by values of SQMI lower than 25 and of CIM with water over 60.
Purchased for the exclusive use of nofirst nolast (unknown)
From: SCC Media Library & Resource Center (library.scconline.org)