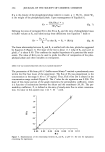
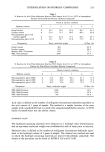
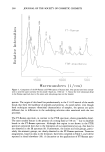
SALICYLIC ACID ENCAPSULATION 2 3 3 E -- KsA[SAø]w q- Ks-IS- ]w (Eq. 4) Vt E is measured experimentally [SAø]w and [S-]w can be calculated at each value of pH from the definition of ionization constant. (The pK of salicylic acid is 2.97.) By inserting appropriate values for pH 2.7 and 5 and solving for the distribution coeffi- cients in Equation 4 simultaneously, the value of K s- was found to be 7.4 while that of Ksao was 113. The ratio of Ksao to K s was about 15. The addition of cholesterol (20% of phospholipid content) to the phospholipid formu- lation was investigated as a possible means of increasing SA entrapment. At the three pH values studied, no significant differences in terms of entrapment were recorded (Figure 1). The fast degradation of phospholipids at low pH (17) restricted their use to values of pH 4.5 and higher in further studies. The effect of phospholipid concentration on SA entrapment was investigated at pH 4.5. An increase of the phospholipid concentration from 0.5% to 10% w/w increased the entrapment of SA from 4.0% to 53.3%. However, the percentage of SA entrapped did not change significantly with a change of SA concentration in the range studied (Figure 2). The mean value was 32.4%, with a standard deviation of 1.51%. The overall partition coefficient, Kv, of SA in the phospholipid vesicles is the ratio of the SA concentration in the phospholipid phase, [SA] t, to the SA concentration in water, [SA] w. [SAIL (SAL/VL) Kv -- [SA]w - (SAw/Vw) (Eq. 5) where SA t is the total amount of salicylic acid entrapped, SA w is the amount free in the aqueous phase, and the other terms have been defined previously. By rearranging the equation, we arrive at: (SAL/SAw) Kv = (VL/Vw) (Eq. 6) lOO • 8o 60 4o 2o b b b 0 i i I i i i 0.2 0.4 0.6 0.8 1.0 1.2 1.4 SA CONCENTRATION (mg/ml) Figure 2. Effect of SA concentration on the entrapment of SA in Phospholipon © 80 liposome (5%) at pH 4.5.

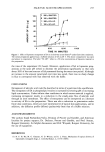
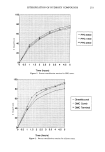
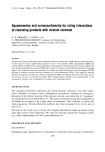
234 JOURNAL OF THE SOCIETY OF COSMETIC CHEMISTS If q is the density of the phospholipid phase relative to water, q = WL/VL, where WL is the weight of the phospholipid phase. Upon rearrangement of Equation 6, (SAL/SAw) X q Kv = (WL/Vw) (Eq. 7) Defining the ratio of entrapped SA to free SA as R s and the ratio of phospholipid mass to buffer volume as R,, and substituting these definitions into Equation 7 leads to RbXq Kv - Rv so that RI• = Rv X (Kv/q) (Eq. 8) The linear relationship between R s and R,, is verified with the data, plotted as suggested by Equation 8 (Figure 3). The slope of the line is about 11.3 ml/g (if R,, and q are in g/ml) r 2 is about 0.99. This confirms the implied hypothesis of a partition-like mech- anism. The value of Kv/q can be used to probe the effect of composition of the phos- pholipid phase and other variables on entrapment. EFFECT OF SA CONCENTRATION ON FLUX ACROSS SILASTIC © The permeation of SA from pH 4.5 buffer across Silastic © reached a pseudosteady state within the first four hours of the experiment. The flux of SA was proportional to the concentration in the range 0.10 to 1.07 mg/ml. Thus, Fick's first law is obeyed in the concentration range studied (Figure 4). The r 2 value for the regression was 0.996. The slope of this linear portion of the graph represents the permeability coefficient, which is a function of interactions between the solute and the membrane (18,19). The per- meability coefficient, P, is defined as the ratio of steady-state flux to solute concentra- tion. Its value in this system was 1.42 X 10⁻³ cm/h. 0.6' rr 1.2' 1.o' {}.8' 0.4' {}.2' 0.0 , , , , , , 0.00 0.02 0.04 0.06 0.08 0.10 0.12 Rv Figure 3. Representation of the relationship between R b and R v at pH 4.5. See text for explanation concerning the expressions.
Purchased for the exclusive use of nofirst nolast (unknown)
From: SCC Media Library & Resource Center (library.scconline.org)