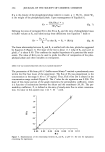
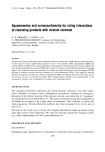
SQUAMOMETRY AND CORNEOSURFAMETRY 271 pings (CSSS) from healthy individuals and a short contact time (two hours) with a solution of cleansing agents (5). After staining samples with PMS for three minutes and air drying, reflectance colorimetry (Chromameter ©, Minolta) is used to derive values of L* and Chroma C*. In a previous study we had reported that irritant surfactants induced both a decrease in L* and an increase in Chroma C* (5). The present evaluations were conducted to better define criteria for selecting "normal" volunteers and concentrations of test products in solution. Corneosurfametry was performed using CSSS collected from the 25 volunteers enrolled in the preliminary study dealing with squamometry. One CSSS from each volunteer was sprayed with water alone, and after staining with PMS, the difference between L* and Chroma C* was calculated to derive a colorimetric index of mildness (CIM). In fact, our experience (5) suggested that CIM is over 50 for mild surfactants and lower than 30 for harsh products. Other CSSS were used for corneosurfametry with So-A and Sy-B, both at 1:100 and 5:100 water dilutions. In addition to the usual two-hour test duration, we also kept the cleanser solutions in contact with CSSS for 8, 24 and 48 hours before PMS staining and colorimetric evaluations. Main study. Corneosurfametry was performed with the 12 products used in the main study involving squamometry. Each product, at dilutions of 1:100 and 5:100 in water, was sprayed on CSSS and kept in a moist environment for two hours. After PMS staining and colorimetric measurements, the color differential, dE*ab, was calculated between each sample and a reference CSSS sprayed with water only. This evaluation will be refered to as the corneosurfametry index (CSMI). STATISTICAL ANALYSIS Means (M), standard deviations (SD), medians (Me), and coefficients of variation (V = 102 SD M- •) were calculated. Differences between series of evaluation were evaluated by the Kolmogoroff-Smirnow test. A p-value lower than 0.05 was considered signifi- cant. Regression analysis models were applied to evaluate the relationships between parameters of squamometry and corneosurfametry. The best model, i.e., linear, loga- rithmic, or exponential, was chosen on the basis of the highest coefficient of correla- tion "r." RESULTS PRELIMINARY STUDIES A significant linear relationship (r -- . 58, p (0.01) was found between the colors of unstained D-Squames placed on a red background and PMS-stained D-Squames placed on a white background (Figure 1). The range of color variations between samples was the largest for the PMS-stained material. Hence, this way of evaluation, which is likely the most sensitive, was chosen for the main study. The overall SQMI was 23.2 -•/- 9.8 (V = 42%). In this group of volunteers, individuals with sensitive skin had always a value of SQMI higher than 25. As a criterion of selection for the main study dealing with normal skin, we only considered the 16 volunteers with SQMI lower than 25, corre- sponding to a mean of 17.7 -•/- 5.5 (V = 31%). By corneosurfametry, values of CIM with water alone were quite uniform (V = 15%)

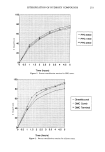
272 JOURNAL OF THE SOCIETY OF COSMETIC CHEMISTS PMS-Stained DE*ab 50 -- 45 - 40 - 35 - 30 - 25 - 20 - 15 - 10 - 5 - ß - i ß ß 0 10 20 30 40 50 Unstained DE*ab Figure 1. Scatterplot of color differentials (DE*ab) evaluated on unstained stratum corneum collected by D-Squames and on the same material stained with Polychrome Multiple Stain (PMS). There is a significant linear relationship (slope 0.28, y intercept 3.2, r = . 58) between these evolutions. The scale of variations is broader after staining corneocytes with PMS. in the overall tested population. Individuals with SQMI lower than 25 had CIM values over 60, corresponding to 68 +/- 4 (V = 6.5%). Corneosurfametry with So-A and Sy-B is presented in Figure 2. Increasing the product concentration and test duration generally induced a reduction in L*, associated with an increase in Chroma C*. There was, however, a limit where any further decrease in L* was associated with a sharp decrease in Chroma C*. Hence, these data, which confirm our previous findings (5), indicated that CIM, which should increase with irritancy, was valid only when L* 45 Chroma C*. Such baseline value was respected for selecting product concentrations and test duration in the main study. MAIN STUDY Despite the selection of volunteers characterized by SQMI 25 and CIM 60, which
Purchased for the exclusive use of nofirst nolast (unknown)
From: SCC Media Library & Resource Center (library.scconline.org)