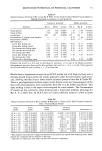
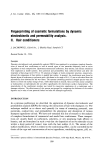
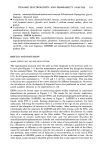
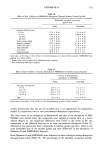
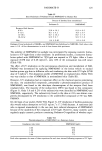
IRRITATION POTENTIAL OF PERSONAL CLEANSERS 71 Table II Relative Irritation Potential of Bar A and Bar B When Tested Under Forearm Wash Protocols Based on Methods Described by Lukacovic (1) and Sharko (6) Attribute Lukacovic procedure Sharko procedure Bar A Bar B p-value Bar A Bar B p-value Visual dryness 2.35 3.02 0.0001 1.19 1.69 0.0001 Visual redness 2.30 2.87 0.0009 1.24 1.54 0.0523 Conductance 164 134 0.0008 179 142 0.0002 Chromameter a* (change from baseline) -- -- -- 0.70 1.36 0.0115 Evaporimeter (TEWL) -- -- -- 9.24 11.7 0.0001 Self-evaluation: Leaves skin feeling soft 0.17 -0.53 0.0011 -0.03 -0.77 0.0102 Leaves skin feeling smooth 0.13 - 0.33 0.0504 0.27 - 0.63 0.0005 Not leaving skin feeling tight 0.03 - 0.20 0. 1287 0.10 - 0.33 0.0735 Not leaving skin feeling dry 0.03 -0.43 0.0136 -0.33 -0.97 0.0214 Not leaving skin flaky 0.23 -0.03 0.1328 -- -- Leaves skin feeling clean 0.80 0.67 0.0434 1.10 1.07 0.5725 Not leaving skin itchy 0.20 -0.07 0.1182 -- -- Which arm is better/how much -- -- 0.90 0.28 0.0088 Irritation was scored on a 0-6 scale in the Lukacovic procedure, a 0-4 scale in the Sharko procedure. Self-assessment questions about specific skin attributes were rated on a -4 to + 4 scale. Values reported are the mean endpoint score or rating n = 30 in both cases. Results from a representative series of ten FCAT studies run with these two bars over a thirteen-month period mirror the results generated under the full forearm wash proto- cols, showing that Bar A has a lower relative irritation potential than Bar B (Table III). There is good agreement between expert visual dryness scores and measurements of the skin's electrical properties both consistently show Bar A to be milder than Bar B. This same ranking is seen in the expert scores assigned for visual redness. The Chromameter a* results are less conclusive, often showing only a directional mildness advantage for Bar A. It is likely that the FCAT does not induce sufficient redness to allow accurate Table III Relative Irritation Potential of Bar A and Bar B Measured in a Series of Ten FCAT Studies Conducted Over a Thirteen-Month Period a Study Visual Visual Electrical number dryness redness impedance b Chromameter a* 316 (n = 43) 1.02/1.32 (0.0397) 1.20/1.35 (0.4569) -0.0958/-0.181 (0.0070) 0.37/0.55 (0.3650) 321 (n = 46) 2.07/2.53 (0.0016) 1.97/2.19 (0.0770) -2.22/-3.41 (0.0314) 0.75/1.41 (0.0024) 323 (n = 41) 1.58/2.02 (0.0037) 1.38/2.12 (0.0001) -0.0190/-0.135 (0.0118) 1.24/1.72 (0.0639) 326 (n = 36) 1.96/2.57 (0.0001) 1.48/2.21 (0.0001) 120/93 (0.0246) 1.31/1.86 (0.5267) 331(n = 40) 0.14/0.69(0.0001) 0.37/0.55 (0.1628) 2.41/- 1.54 (0.0001) -- 332 (n = 40) 2.31/2.41 (0.4255) 1.59/1.55 (0.7616) --2.72/-2.82 (0.8779) 1.34/1.58 (0.2790) 333 (n = 37) 1.60/2.37 (0.0001) 1.07/1.90 (0.0001) 89.9/58.2 (0.0001) 0.37/0.94 (0.0030) 337 (n = 39) 1.16/1.60 (0.0001) 1.10/1.64 (0.0007) 85.8/62.3 (0.0001) 0.80/0.96 (0.3465) 338 (n = 39) 1.32/1.95 (0.0002) 1.10/1.66 (0.0014) --0.144/--0.324 (0.0001) 1.30/1.74 (0.0184) 350 (n = 33) 0.30/0.82 (0.0001) 0.07/0.37 (0.0037) 18.0/15.5 (0.0001) 0.42/0.46 (0.8255) • Mean endpoint values (absolute or change from baseline) for each attribute are reported as Bar A/Bar indicate that a parameter was not measured in that study. • Capacitance or conductance some values may have been converted to logarithms. B (p-value). Dashes

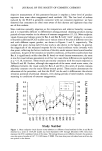
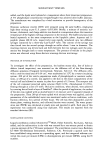
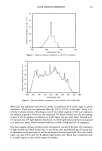
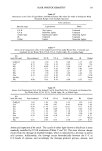
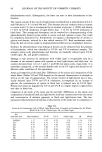
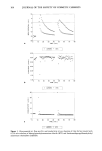
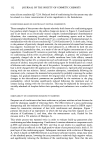
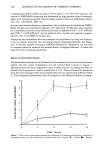
72 JOURNAL OF THE SOCIETY OF COSMETIC CHEMISTS objective measurement of this parameter because it employs a lower level of product exposure than some other exaggerated wash methods (10). The low level of redness induced by the FCAT is generally consistent with our consumer experience: we have observed that consumers are often more aware of skin dryness and tightness than they are of skin redness. Skin condition naturally improves as the temperature and relative humidity increase, and it is reportedly difficult to differentiate among personal cleansing products during periods of warm weather in the absence of extreme exaggeration (11, 12). Mean endpoint visual dryness and redness scores for Bar A and Bar B, both "mild" products, in a series of fourteen additional FCAT studies run at various times of the year at different test sites and with different expert graders, are shown in Figures 1 and 2, respectively. The average dew point during each five-day study is also shown in the figures. In general, the magnitude of the measured response for the visual attributes varies inversely with dew point, reflecting the better condition of the skin under warmer more humid weather conditions. In spite of the variation in weather conditions, all fourteen studies show that Bar A is significantly milder than Bar B, based on visual dryness assessments the same is true for visual redness assessments in all but two cases (these differences are significant at p 0.10, however). These results are entirely consistent with the results reported in Tables II and III. Further, although the magnitude of the mean visual scores varies, the difference between the visual scores for Bars A and B in this series of studies remains relatively constant over the entire fifteen-month period. These results demonstrate the robustness of the procedure, and that the FCAT can be used to differentiate the relative irritation potential of personal cleansers, even during periods of mild weather, without resorting to conditions of extreme exaggeration. 3.5 o 3.0 • 2.5 • 2.0- " 'I.,5- 1.0- v• 0.,5- 0.0- .... Dew Point ..,.. ..': o - Bar A ::'" '"'":':"'"" i ©-Barb ... '. .. .. I I I I I I I I I I I I I I 0 0 •- (•3 •- I',- I',- eO 03 03 0 0 0 •- 80 7O so 5O 4O 3O 20 10 Study Number Figure l. Mean endpoint visual dryness scores (absolute or difference from baseline) for Bar A and Bar B observed in a series of 14 FCAT studies run from September 1991 through December 1992. Error bars represent the 95% confidence limits of the mean. The average dryness score difference between the products over this series of studies is 0.67 -+ 0.029 (mean + SEM). The mean dew point calculated over each five-day test period is also shown.
Purchased for the exclusive use of nofirst nolast (unknown)
From: SCC Media Library & Resource Center (library.scconline.org)