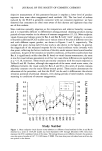
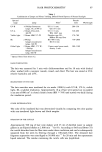
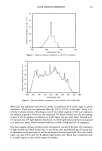
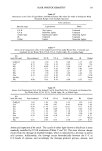
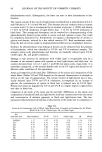
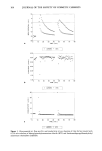
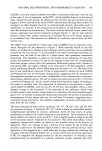
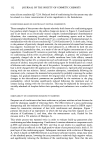
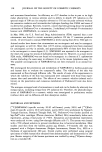
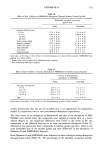
IRRITATION POTENTIAL OF PERSONAL CLEANSERS 3.5 3.0 2,5 2,0 1.5 1.0 0,5 0,0 .... Dew Point , ..:. o - Bar A !'". .'" '". ß - Bar B ß , ,. I I I I I I I I I I I I I I 0 0 .r- • q•- I"-, I"-, c30 03 03 0 0 0 • 80 60 5O 4O 3O 20 '- 10 Study Number Figure 2. Mean endpoint visual redness scores (absolute or difference from baseline) for Bar A and Bar B observed in a series of 14 FCAT studies run from September 1991 through December 1992. Error bars represent the 95 % confidence limits of the mean. The average redness score difference between the products over this series of studies is 0.49 - 0.034 (mean +- SEM). The mean dew point calculated over each five-day test period is also shown. Additional commercial bars and water were included as treatments in several studies to broaden the range of formula compositions examined and to demonstrate the FCAT's ability to rank-order treatments on the basis of their relative irritation potential. These results are summarized in Figure 3. The FCAT ranks the treatments in a manner that is consistent with expectations based on formula composition, and with results gener- ated under other mild to moderately exaggerated wash protocols. In general, bars with a higher soap content exhibit a higher irritation potential. The level of skin irritation reached by the FCAT procedure, however, is generally lower than the level reached in more exaggerated procedures, even for bars with a relatively high soap content. One benefit of the FCAT's relatively low exaggeration and irritation levels is that the FCAT is able to show positive mildness benefits afforded by special technologies such as cellulose polymers. For example, Bar E contains more total soap than Bar B, yet Bar E is ranked milder for both dryness and redness. This outcome is consistent with the skin-protectant properties previously reported for these cellulose materials (4,5). Skin condition is known to vary along the volar forearm surface (7, 13). For example, the mid-forearm is reported to be drier than sites nearer the elbow and wrist (7). This same pattern is observed at baseline in FCAT studies. Further, the forearm skin sites respond in differing degrees during treatment (Table IV). Side (left arm versus right arm) differences may also be significant. The ANOVA model used to analyze FCAT data corrects for these conditions, and offers two distinct advantages over typical two-sample models. First, the ANOVA model uses a pooled error from all treatments. Thus, when more than two treatments are present, the FCAT model is more precise. Second, the ANOVA model statistically accounts for sources of true error (i.e., due to treatment

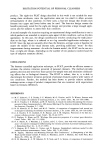
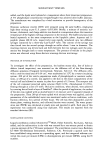
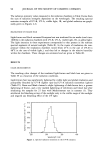
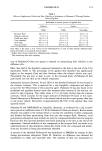
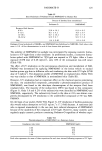
74 JOURNAL OF THE SOCIETY OF COSMETIC CHEMISTS 1.00 - 1,00 0.75 - o 0.50 - "- 0.25 - •) 0.00 - -0.25 - Bar D (n = 6) Bar B (n = 27) Bar E (n = 3) Bar A Bar C (n = 5) 0.75 •F Bar D (n = 6) 0.50 • Bar B (n = 27) 0.25 iliii Bar E (n = 3) 0,00 © Bar A -0,25 I Bar C (n = 5) Water (n = 5) -0.50- • Water (n = 5) -0.50 Figure 3. FCAT milc.ness ranking of the commercial test bars based on expert visual dryness (left) and redness (right) assessment. All results are expressed relative to Bar A scores for water (moistened towel) are included for reference. Error bars represent the standard error of the mean (difference from Bar A). Table IV Example of Skin Variation and Reactivity Along the Volar Forearm Surface Forearm treatment site Baseline dryness Endpoint dryness Site 1 (nearest elbow) 0.20 1.22 Site 2 0.30 1.61 Site 3 0.33 1.47 Site 4 (nearest wrist) 0.24 1.01 The mid-forearm is consistently found to be drier than the areas near the wrist and elbow at baseline, and to yield higher dryness scores (averaged over all treatments) at endpoint. In this example, the sites at the mid-forearm are significantly drier than the other two sites at baseline and at endpoint (data from study 294 n-- 38). site, side, subject, and site x side interaction) outside the mean square error. These have not been considered in some previous models (13), although they may be significant. Accounting for these additional sources of error provides a more sensitive test and provides greater precision and sensitivity than typical two-sample models. In addition, the FCAT minimizes the effect of biological diversity (i.e., intersubject variability), since up to eight product comparisons are made on each subject. The FCAT studies referred to in this work involved application over eight forearm treatment sites. This design is invaluable during the early stages of product development to quickly remove "bad" formula candidates from further consideration on the basis of their relative irritation potential. The general FCAT design may be modified to address additional formulation targets as the development process progresses. For example, consumer perceptions of skin effects are very important to the success of the final
Purchased for the exclusive use of nofirst nolast (unknown)
From: SCC Media Library & Resource Center (library.scconline.org)