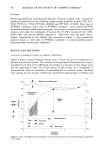
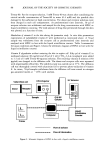
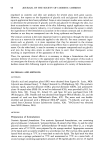
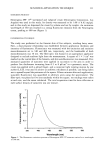
88 JOURNAL OF THE SOCIETY OF COSMETIC CHEMISTS Tween-80. For the receptor solution, 5 mM Tween-80 was chosen after considering the critical micelie concentration of Tween-80 in water (0.4 mM) and the possible skin damage by the surfactant at high concentration. The donor and receptor solutions were then charged in each cell compartment. At predetermined time intervals, 30 I•l of receptor solution was withdrawn and assayed for the drug concentration with HPLC or liquid scintillation counting. The total amount of drug that permeated through the skin was plotted as a function of time. Metabolism of vitamin E in the skin during the permeation study. In vitro skin permeation experiments of radiolabeled vitamin E were performed as mentioned above. A 70-1•1 sample was withdrawn from the receptor cell at predetermined time intervals and analyzed with HPLC in line with the liquid scintillation counter. Table I summarizes the assay conditions and Figure 2 shows the schematic diagram of HPLC in line with the liquid scintillation counter. Vitamin E degradation without contacting the skin in receptor cell. Fifty I•l of vitamin E in methanol solution (10 mg/ml) and 20 I•l of 2 mCi [•H]2-3,4-ot-tocopherol were added to 3.5 ml of 5 mM Tween-80 aqueous solution. The resulting vitamin E solution (140 I•g/ml) was charged in the diffusion cells. The donor and receptor cells were separated with impermeable teflon film. The stability study was carried out at 37øC. The diffusion cell was thoroughly covered with aluminum foil to prevent photo-oxidation of vitamin E. At times, 70-1•1 samples withdrawn from the diffusion cell were stored in nitrogen gas-saturated inserts at -20øC until analysis. Valla-Chlen cell Donor IReceptor HPLC/InJector Sample i C18 RP i Column I i Computer Printer UV detector i•.•.•.•.•.----a Liquid Scintillation J Counter Flow of solvent ........ Flow of Information Figure 2. Schematic diagram of HPLC in line with a liquid scintillation counter.

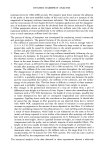
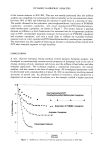
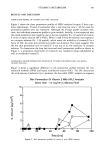
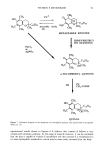
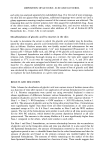
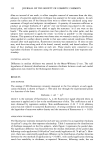
VITAMIN E METABOLISM 89 RESULTS AND DISCUSSION PERMEATION PROFILE OF VITAMIN E BY HPLC ANALYSIS Figure 3 shows the three permeation profiles of HPLC-analyzed vitamin E from trip- licate experiments. Vitamin E permeated after a very long lag time (--48 hr), and the permeation profiles were not consistent. Although the average profile increases with time, the individual permeation profile is quite variable. Initially, it was suspected that this small permeation rate might be due to the low solubility (Cs: 18 mg/ml) of vitamin E in the receptor solution (40 % PEG). When 5 mM Tween-80 solution was employed as a receptor solution (Cs: 2.26 mg/ml), which raised the solubility of vitamin E by a factor of 100, the same skin permeation profile was obtained. This result suggests that the low skin permeation rate of vitamin E is not due to its low solubility in receptor solution. To characterize the long lag times and small permeation profiles as shown in Figure 3, a permeation experiment of vitamin E was conducted using radiolabeled as well as nonlabeled vitamin E. COMPARISON OF SKIN PERMEATION PROFILES OF VITAMIN E BETWEEN HPLC AND RADIO TRACER ANALYSIS Figure 4 shows a significant difference in the permeation profiles between the two analytical methods, HPLC and liquid scintillation counter (LSC). The LSC determines the total amount of radioactivity to permeate the skin while HPLC analysis can separate Skin Permeation Of Vitamin E With HPLC Analysis Donor Soln ß 13 mg/ml in Silicone Fluid 10 6 i / / -'O o 0 20 40 60 80 1 o0 Time (hrs) Figure 3. Skin permeation profiles of vitamin E with HPLC analysis.
Purchased for the exclusive use of nofirst nolast (unknown)
From: SCC Media Library & Resource Center (library.scconline.org)