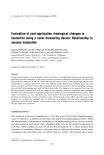
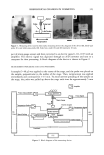
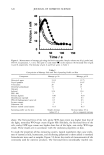
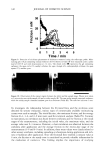
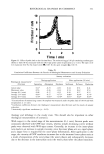
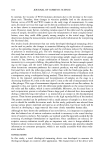
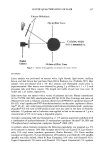
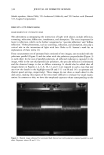
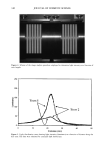
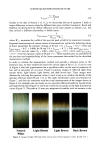
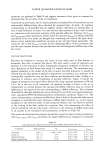
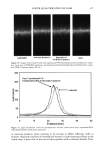
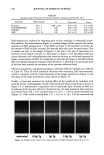
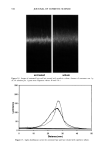
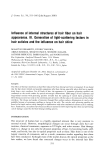
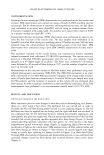
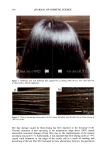
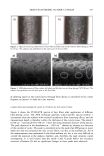
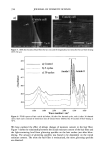
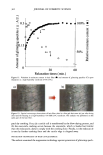
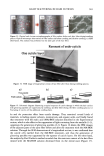
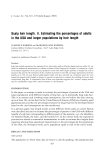
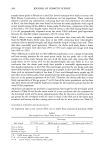
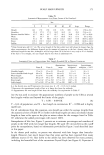
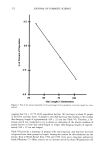
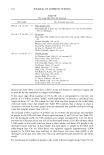
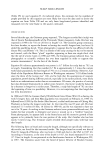
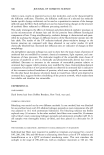
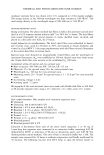
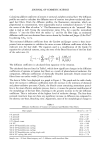
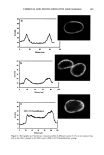
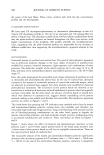
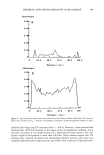
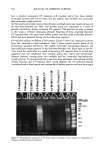
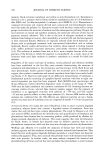
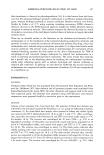
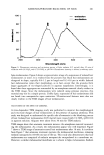
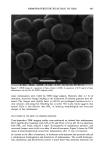
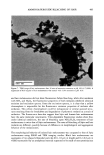
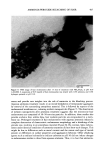
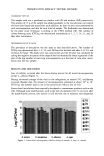
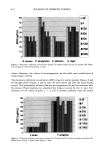
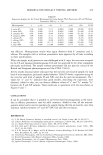
330 JOURNAL OF COSMETIC SCIENCE 3O ._u lo 0 I 2 3 4 5 Time / min Figure 9. Detection of stickiness phenomena of thickeners measured using the roller-type probe. Mois- turizing gels (10 !al) containing various thickeners (0.5%) shown in Table III were measured under a probe load of 0.05 N and with reciprocation at 2.4 cm/s. The closed circle (0) represents the gel containing carbomer the open circle (¸), methyl cellulose the open triangle (/•), carboxymethyl cellulose the open square (U]), xanthan gum. Figure 10. Observation of the contact region between the roller and the sample stage. Photos were taken at 2 min with a non-sticky sample (A) and a sticky sample (B). The non-sticky sample contained carbomer, while the sticky sample contained xanthan gum as a thickener (Table III). The scale bar indicates 5 mm. To investigate the relationship between the frictional force and the stickiness score obtained by sensory evaluation, various types of commercially available moisturizing creams were used as samples. The initial friction, the maximum friction, and the average friction (0-3, 3-6, and 6-9 min) were used for statistical analysis (Table IV). Contrary to expectation, no correlation was found between stickiness and the friction at the initial stages of the measurements, including the initial value, the maximum value, and the average value over 0-3 minutes. However, a clear correlation was observed between the stickiness after application and the average friction in the mid-to-late stage of the measurements (3-6 and 6-9 min). In addition, these mean values were clearly related to other sensory attributes, including spreading or absorption during application and rich- ness or hydration after application. Since the frictional force reached a constant value at 6 min, the friction at the steady state is considered to provide valuable information for the evaluation of cosmetics. This finding implies the importance of studying

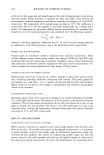
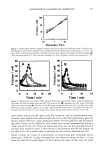
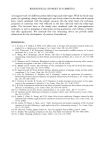
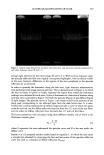
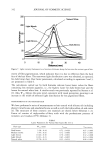
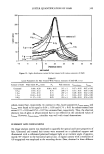
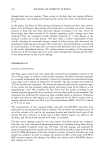
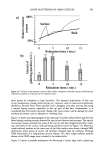
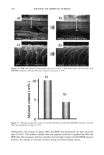
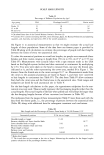
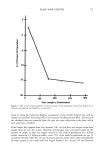
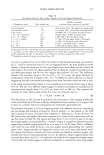
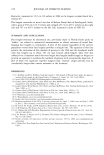
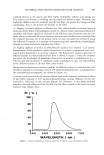
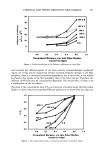
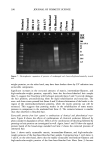
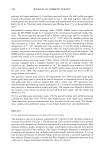
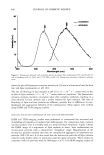
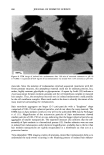
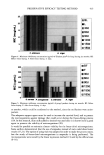
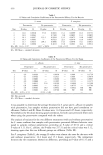
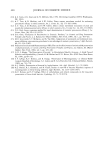
RHEOLOGICAL CHANGES IN COSMETICS 331 10 z 8 o o 1 2 3 Time I rnin Figure 11. Effect of probe load on the frictional force. The moisturizing gel (10 pl) containing xanthan gum shown in Table III was measured with the roller-type probe under reciprocation at 2.4 cm/s. The open circle (C)) represents 0.02 N the closed circle (•), 0.05 N the open triangle (•), 0.01 N. Table IV Correlation Coefficients Between the Results of Rheological Measurement and Sensory Evaluation Sensory evaluation During application After application (30 min) Rheological measurement a (Friction) Spreading Absorption Freshness Stickiness Richness Hydration Initial value 0.41 b -0.25 -0.32 0.44 0.51 0.41 Maximum value 0.56 - 0.26 - 0.42 0.54 0.62 0.53 Average (0-3 min) 0.48 -0.17 -0.35 0.50 0.57 0.52 Average (3-6 min) 0.81' -0.57 -0.71' 0.80* 0.84* 0.74* Average (6-9 min) 0.78* -0.66* -0.70* 0.81' 0.82* 0.69* a Ten microliters ofmoisturizing cream (10 samples) was measured under the probe load of 0.05 N and with reciprocation at 2.4 cm/s. b Correlation coefficients between the theological measurement data (friction) and the results of sensory evaluation. * Statistically significant correlations (2 0.05). rheology and tribology in the steady state. This should also be important in other rheological measurements of cosmetics. With respect to the initial stage of the measurements (0-3 min), friction peaks were commonly observed with O/W-type creams, whereas simple decreasing curves without peaks were observed with W/O-type creams. Generally, an increase in the inner-phase ratio leads to an increase in sample viscosity, since the inner phase acts as a rigid sphere and a larger force is required for the outer-phase deformation. After application to the stage, the viscosity of O/W emulsions increases due to the increased inner-phase ratio as a result of evaporation of the outer phase (the water phase), and subsequently decreases due to the decrease in the inner-phase ratio (the water phase) after the phase transition.
Purchased for the exclusive use of nofirst nolast (unknown)
From: SCC Media Library & Resource Center (library.scconline.org)