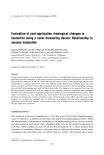
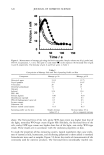
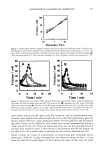
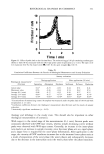
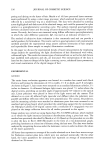
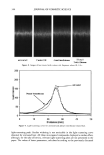
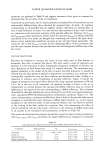
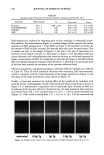
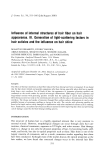
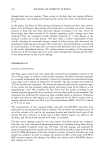
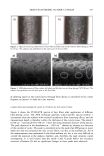
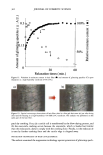
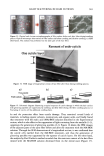
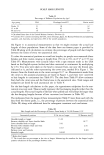
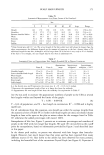
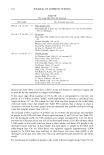
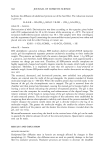
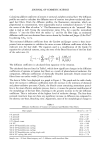
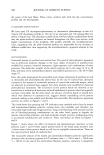
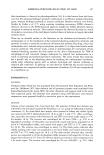
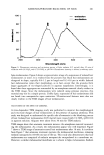
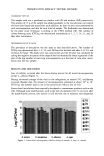
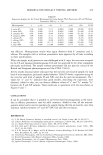
322 JOURNAL OF COSMETIC SCIENCE lems, Aust et•/. (1) developed a more objective and controlled descriptive method. This method involves a trained descriptive panel that is capable of identifying and defining attributes of test products through the use of reference materials and is able to measure the relative intensities of product attributes on a numerical scale. The descriptive method is able to yield consistent data compared with less objective consumer evalua- tion, but it still has difficulties in evaluating large numbers of test samples. As an alternative to sensory evaluation, objective evaluation methods by means of instrumental measurements have been studied using conventional rheometers (e.g., the cone/plate viscometer or reciprocation-type rheometer) (2-5) or measuring systems that simulate the application processes of cosmetics (6-8). The use of i, vivo friction mea- surements to evaluate skin condition has also been studied by many investigators (9- 13). These measurements basically depend on the detection of the force conducted to the probe through a thin film of the sample, although there are differences in probe geometry. Despite the above research, instrumental predictions of subjective sensation on the skin are still rarely used in the actual development of cosmetics. This is partly due to the intrinsic technical difficulties of simulating human sensation processes, which are highly complex and sensitive. The reported procedures may be inadequate to obtain the nec- essary information, since many sensory attributes are used in the subjective evaluation process, such as spreadability, stickiness, richness, dewiness, greasiness, and so on. Moreover, most studies focused on the initial properties of cosmetics and only a few have involved successive measurements (e.g., 0, 5, 10, and 30 rain after the application). Continuous monitoring of the properties of cosmetic samples after application may be the most effective approach to instrumental prediction of subjective sensation. In this paper, we describe a novel rheological measuring device developed to study the rapid changes in the physical properties of cosmetics after application, and we discuss the relationship of the results to the results of sensory evaluation. The characteristics of the system are described in detail, focusing on the detection of the changes in spreadability and stickiness after application. EXPERIMENTAL STRUCTURE OF THE MEASURING DEVICE Figure 1 shows the novel rheological measuring device used in this study. The device can measure frictional force (0.001-0.1 N) between a probe and the surface of the sample stage, which reciprocates horizontally at a constant speed (amplitude: 30 ram speed: 1-8 cm/s). Two different probes (block-type and roller-type Figure 1 C, D) were used with a constant load (0.02-0.3 N). The block-type probe has a curved contact surface (curvature radius: 10 ram) covered with polyimide film. The roller-type probe has an aluminum roller (diameter: 10 ram) equipped with ball bearings (MF63, NSK, Tokyo). The bearings were lubricated with low-viscosity oil (decamethylcyclopentasiloxane, Shin- Etsu Chemical, Tokyo) each time, just before the measurement, and the baseline friction (the friction measured without sample application) was less than 0.001 N at 0.05 N probe load. The surface of the sample stage was covered with polyimide film. The detected force was conducted through a leaf spring (10 x 25 x 0.2 ram, phosphor bronze) to a

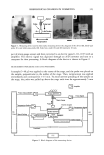
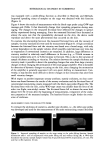
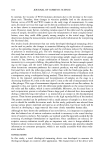
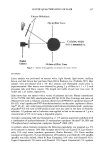
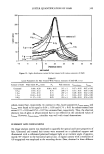
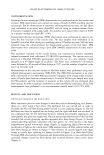
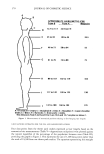
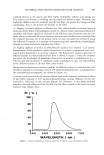
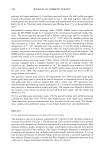
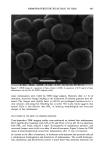
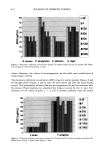
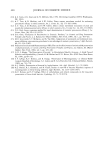
RHEOLOGICAL CHANGES IN COSMETICS 323 A Pro• • P•be load ,,. ,•..7 :,,U' ' 7.•. Fr.i.c• ion .. ß Reciprocation D Figure 1. Measuring device used in this study: measuring device (A), diagram of the device (B), block-type probe (C), and roller-type probe (D). Scale bars under (C) and (D) represent 10 mm. pair of strain gauge sensors and then converted to an electric signal (-10-10 V) with an amplifier. The electric signal was digitized through an A/D converter and sent to a computer for data processing. A block diagram of the device is shown in Figure 2. MEASUREMENT PROCEDURE AND DATA PROCESSING A sample (5-40 pl) was applied to the center of the stage, and the probe was placed on the sample, perpendicular to the surface of the stage. Then, reciprocation was applied immediately and continued for 3-15 min. To avoid uneven spreading of the sample on the stage, the probe was pulled up above the stage each time for approximately 5 mm [• :Amplifier //// Probe Lifting ONIOFF • : RøtarylSølenøid [ F Temperature Setting Prøbe•_. L Then-no Couple / •l •----C • Temper/Signa Speed Setting Servomotor Bal?S•rew • 3, •. I Cø II I Position Signal • / Feedback ( •1 Linear Pøtentiø/I"' Figure 2. Block diagram of the measuring device.
Purchased for the exclusive use of nofirst nolast (unknown)
From: SCC Media Library & Resource Center (library.scconline.org)