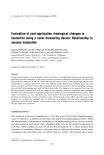
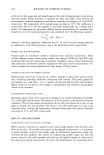
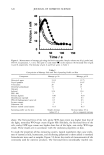
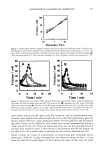
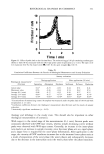
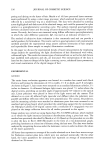
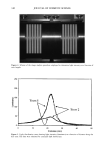
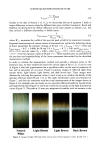
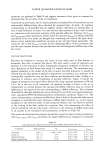
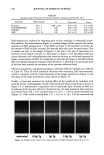
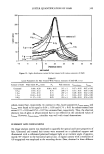
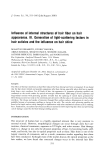
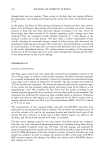
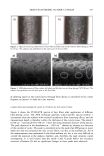
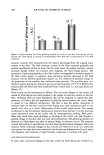
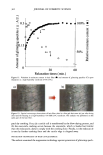
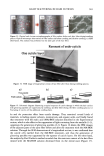
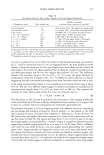
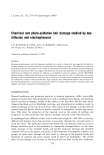
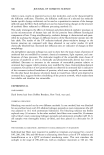
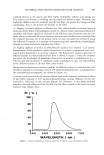
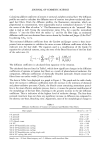
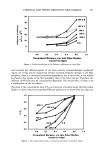
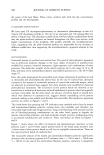
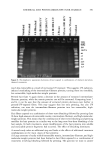
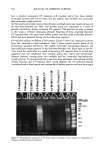
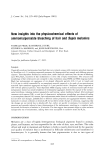
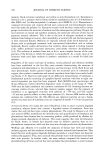
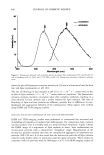
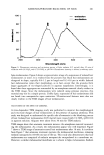
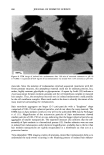
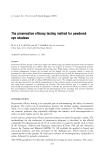
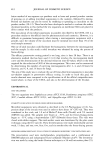
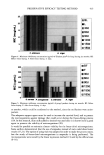
PRESERVATIVE EFFICACY TESTING METHOD 415 C. albicans A. niger Fiõure 4. Minimum inhibitory concentradon (pg/ml) of Glydant plus © for fungi during six months. Before freeze-drying. F: After freeze-drying. d: days. •]BF 5o0 .': i::-•:?"i:: ?: :?-i' ?:.if'•'7':-•: _'.:•. '. :::::::::[::::)':5 ii -•'::'?!::•?•: : !!:!':!::i'• : -':::::.::!::: [] F E •60d • • • -'-= .... :'"•::! i•i:•' ::177:.::::__:__-'-i:120d•::'--:-::':•'*:• S. aureus p. aeruginosa C. albicans A. niger FJõure •. Minimum inhibkory contentradon (pg/ml) of propy! paraben during six months. B•: Before freeze-drying. F: After freeze-drying. d: days. to another, which could be attributed to the method, since the oscillations were unim- portant. The adequate support agent must be used to increase the survival level, and to protect the microorganisms against damage that could occur during the freeze-drying process (19). In this research, skim milk added to inositol was used since it is known to be a good agent to preserve the viability of microorganisms (20). It would be possible to maintain a better viability for the freeze-dried microorganisms. Some authors demonstrated that the use of ampoules instead of vials could show better results (17,21). The option of using vials was adopted in order to make the process easier, but the study of freeze-dried microorganisms in ampoules is being performed. The microorganisms were tested by the linear regression method (13) and by the official ones (6-1o).

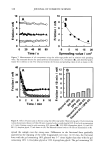
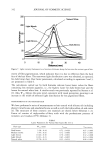
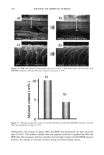
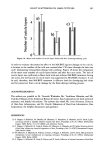
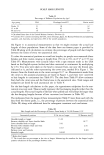
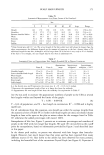
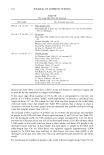
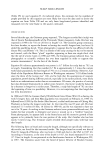
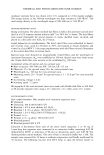
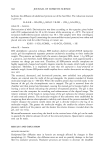
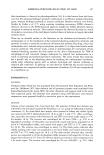
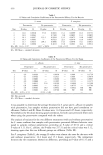
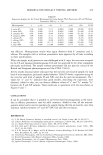
416 JOURNAL OF COSMETIC SCIENCE Table I D-Values and Correlation Coefficients of the Preservative Efficacy Test for Bacteria Test S. aureus P. aeruginosa Preservative No preservative Preservative No preservative D-value R D-value R D-value R D-value R 1 12.0 2 14.9 3 16.1 4 14.5 5 13.7 6 10.1 M_+ SD 13.6_+ 1.97 0.9938 57.8 0.9603 13.1 0.9999 16.3 0.9751 0.9963 -- 0.7309 9.8 0.9892 13.1 0.9805 0.9997 133.3 0.9924 13.2 0.9472 14.8 0.9897 0.9993 -- 0.6423 22.1 0.9570 13.9 0.9927 0.9635 294.1 0.9896 14.3 0.9978 14.1 0.9813 0.9990 -- 0.4672 13.9 0.9921 18.2 0.9912 161.7 _+ 98.54 14.4 + 9.15 15.1 + 4.2 M + SD: Mean + standard deviation. Table II D-Values and Correlation Coefficients of the Preservative Efficacy Test for Fungi C. albicans A. niger Preservative No preservative Preservative No preservative Test D-value R D-value R D-value R D-value R 1 4.6 0.9420 -- 0.0458 0.000 -- 0.1726 2 4.3 0.9706 -- 0.2421 0.000 0.4079 3 4.4 0.9886 -- 0.0400 0.8891 0.8807 4 4.0 0.9888 -- 0.1095 -- 0.2121 -- 0.3375 5 7.3 0.9011 21.6 0.9199 0.4064 -- 0.1300 6 6.8 0.9846 -- 0.8323 0.8755 0.5704 7 3.8 0.9946 19.9 0.9942 -- 0.0922 NE NE 8 4.4 0.9960 25.2 0.9700 NE NE NE NE M + SD 4.95 + 3.51 22.23 + 3.83 NE: Not executed. M + SD: Mean + standard deviation. It was possible to determine the average D-values for S. aureus and C. albicans in samples with preservative, but samples without preservative did not have good correlation co- efficients (Tables I and II). Mean D-values were 13.6 hours and 4.95 hours, respectively. Nevertheless the D-values showing good correlation, for both cases presented lower rates when using the preservative compared with the others. The analysis of variance for the two different treatments (with and without preservative) for S. aureus confirms that samples with preservative presented different behavior com- pared to samples without preservative, providing an F-value of 10.54 and a critical F-value of 5.11. For C. albicans, the F-value was 217.51 and the critical value was 5.12, showing again that the two different groups are different (Table III). For P. aeruginosa (Table I), the average D-values were almost the same for the tests with and without preservative: 14.4 hours and 15.1 hours, respectively. The comparison between the two treatments showed no difference, providing an F-value of 0.131 and a
Purchased for the exclusive use of nofirst nolast (unknown)
From: SCC Media Library & Resource Center (library.scconline.org)