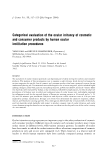
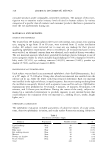
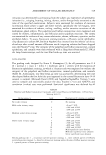
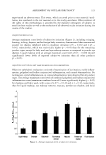
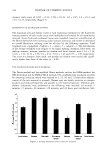
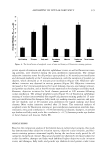
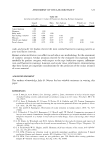
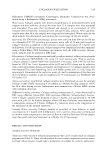
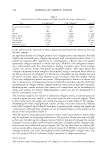
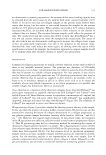
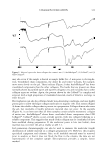
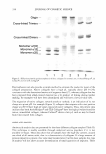
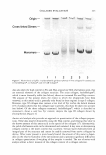
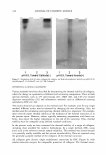
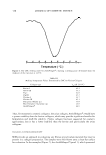
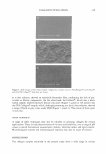
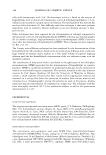
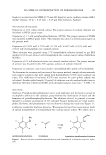
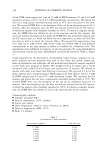
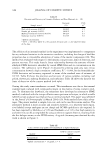
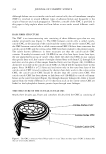
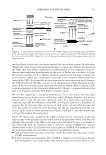
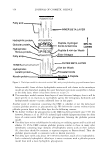
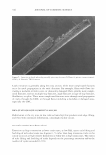
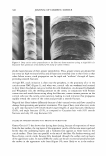
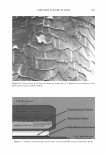
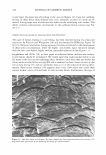
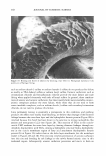
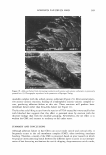
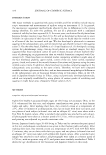
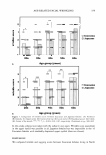
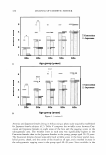
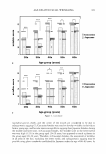
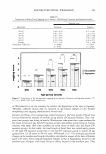
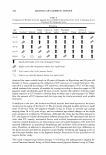
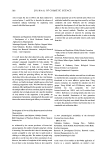
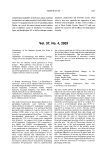
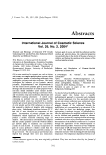
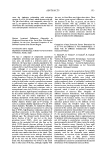
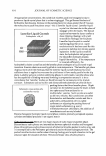
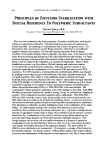
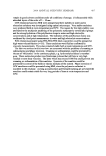
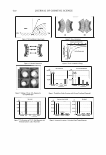
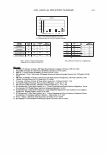
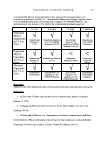
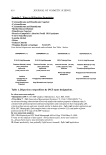
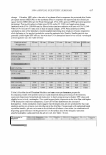
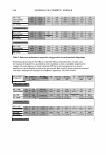
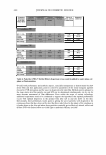
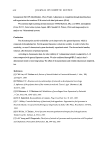
COLLAGEN EVALUATION 333 2 %T 4000.-0 1500 )000 cm-) Figure 2. Infra-red spectra for three collagens for cosmetic use: (1) AteloHelogen®, (2) Collasol®, and (3) CLR Collagen®. may also occur if the sample is heated in sample buffer for 2 min prior to electropho resis. Crosslinked chain components, the dimer r3- and trimer )'-chains, for example, move more slowly on the gel. These indicate (Figure 3) that AteloHelogen® has fewer crosslinked components than the other collagens. The bands that are present are those normally shown by purified type I and type III collagens (22), and no bands due to other collagen types are evident. Again, the pattern shown by the Collasol® is complex and atypical, with a high proportion of crosslinked material, much of which is too large to enter the gel. Electrophoresis can also be performed under non-denaturing conditions, and uses highly porous gels to allow the larger collagen molecules to migrate (14). This system (Figure 4) shows the soluble collagen that is present in a preparation. Collagen dimers also enter the gel, but insoluble or highly polymeric material does not enter. In the example (Figure 4), it can been seen that all three samples contain soluble monomeric collagen of native size. AteloHelogen® shows fewer crosslinked dimer components than CLR Collagen®. Collasol® shows a poor, streaky pattern, with less collagen behaving as a soluble component. This suggests that much of this collagen may be crosslinked or have been modified during preparation. If the isoelectric point is low (see below), then material may not enter the gel as readily at pH 3.1. Gel permeation chromatography can also be used to examine the molecular weight distribution of soluble material in a collagen preparation (23). However, this requires specialized equipment and columns. Also, as all insoluble material must be removed prior to analysis so that it does not block the flow in the column, the data are not representative of the complete sample. Electrophoresis provides a simpler, better method.

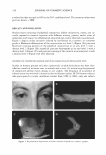
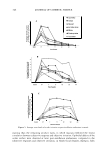
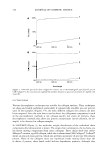
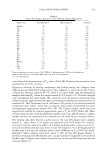
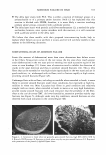
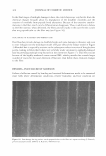
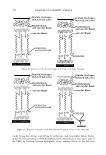
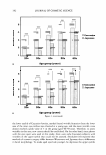
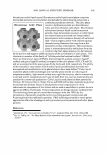
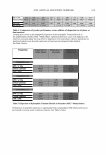
334 JOURNAL OF COSMETIC SCIENCE Origin Cross-linked Trimers - Cross-linked Dimers - Monomer a1[111] _ Monomer a1 [I] _ Monomer a2[1] _ 1 1 2 2 3 3 Figure 3. SDS-polyacylamide gel electrophoresis of three collagens for cosmetic use: (1) AteloHelogen®, (2) Collasol®, and (3) CLR Collagen®. Electrophoresis can also provide a simple method to estimate the isoelectric point of the collagen preparation. Native collagens have a high pl, typically above pH 9 (24), consistent with the determined amino acid sequence data ( 17), whereas collagen that has been prepared from alkali-treated material (as a by-product of liming during leather making, for example) will have been deamidated and will have a low pl value (24). The migration of native collagen, towards anode or cathode, is an indication of its net charge at a given pH. For example (Figure 5), collagens that migrate with a net positive charge at pH 9.0 have high pl values typical of native collagens. Thus, the present data indicate that both AteloHelogen® and CLR Collagen® have the high pl values found for native, unmodified collagen, whereas Collasol® shows a low pl, such as may be found from lime-treated hide collagen. AMINO ACID ANALYSIS Amino acid analysis data are presented for the three different collagen samples (Table II). This technique is readily available through analytical service providers if it is not available in-house. These data show that all samples have the high Gly content, around one third of all amino acids, that is a characteristic of collagens. If a large amount of protein impurity is present, this value may become lower, but for most samples this type of analysis will not allow accurate determination of small quantities of impurity. These
Purchased for the exclusive use of nofirst nolast (unknown)
From: SCC Media Library & Resource Center (library.scconline.org)