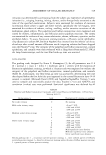
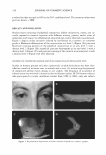
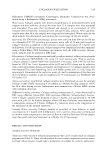
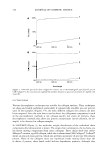
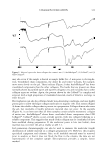
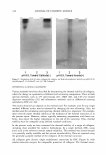
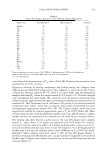
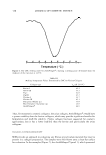
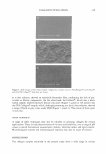
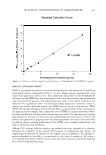
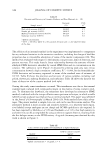
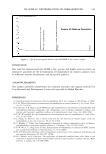
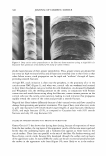
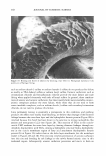
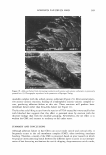
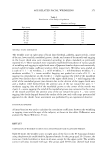
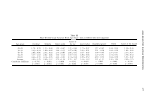
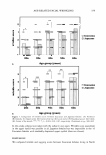
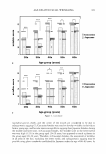
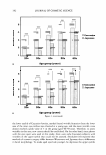
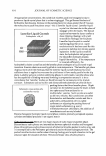
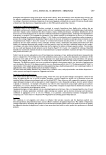
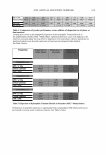
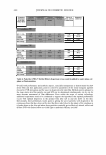
COLLAGEN EVALUATION 331 as a humectant in cosmetic preparations. An estimate of this water-binding capacity may be obtained from the water regain by dry samples held under constant humidity (32%) (Table I). It can be seen that all collagen samples in the present study showed water regain after drying, but the extent or rate varied between the samples for the present method at 32% relative humidity. When samples were held at 87% relative humidity (saturated Na2CO3 ), all absorbed sufficient water to form solutions or wet slurries of collagen (data not shown). The variation between samples could reflect the presence of salts. The conductivity and ash content data (Table I) show that AteloHelogen® has a very low salt content, whereas the other two samples both contain salts. The nature of the salts (which was not determined) could appear to increase the collagen water regain if they are particularly hygroscopic, but this is not apparent in the present study. Alternatively, they could reduce the water regain, by slowing down the rate at which equilibrium is attained, for example. An alternative approach to compare samples would be to examine them after extensive dialysis to remove any salts present. SPECTROSCOPY Commercial collagen preparations are usually colorless solutions or they may be white if there is any insoluble material present. The principal use, therefore, of UV/visible spectroscopy is not to detect colored impurities, but rather to assess the level of turbidity that may be present in a soluble collagen preparation. For clear samples, it may also be used to detect and potentially quantitate any UV-absorbing preservatives that may be present. Material may be assessed as supplied or after dilution, for example, either in water so as to minimize changes in pH or in dilute acetic acid so as to ensure the solubility of non-cross-linked components, as in certain preparations it is possible that soluble collagen has formed into fibrils at neutral pH. As an illustration, comparison of the three test collagens shows that AteloHelogen® was particularly transparent as supplied, whereas both CLR Collagen® and Collasol® were turbid (Figure lA). After dilution in water to equivalent concentrations of 1 mg/ml, the clarity of Collasol® was still poor, while that for CLR Collagen® was significantly improved, although still much less than AteloHelogen® (Figure lB). The solubility of Collasol® was improved in acetic acid (data not shown). IR spectroscopy (Figure 2) provides a method for showing protein identity in the sample. It may also show the presence of organic buffers or preservatives. IR spectroscopy also has potential for assessing the extent of collagen denaturation in a collagen preparation, as any gelatine present changes the relative intensity of the bands at 1660 cm- 1 and 1633 cm- 1 (19). However, this requires high resolution. In the present study, the resolution of the IR spectra was not sufficient, and also seemed to vary between preparations (Figure 2). Thus IR spectroscopy may not be a convenient method for estimating the content of denatured collagen (gelatine) present in a sample. The collagen/gelatine content of fully clear solutions may otherwise be examined by ORD or CD spectroscopy, where standard values have been reported (20,21), but this requires access to specialized equipment. Sample clarity is an issue: insoluble collagen interferes and can be removed by centrifu gation, but the resulting analysis is not representative of the total sample. Loss of gelatine components after brief proteolysis, where collagen is stable, followed by colla gen precipitation, also provides a convenient method for estimating gelatine content.

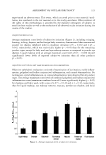
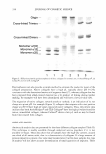
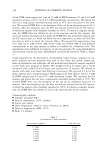
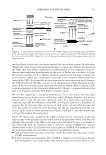
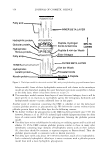
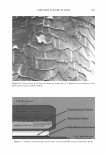
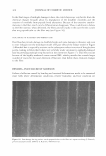
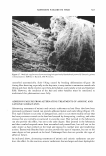
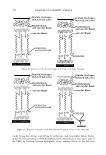
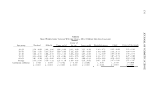
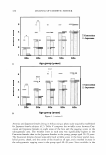
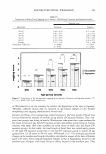
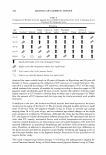
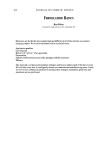
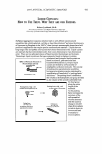
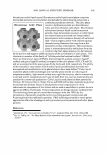
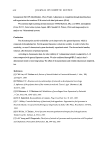
332 JOURNAL OF COSMETIC SCIENCE A 100% "iii (/) ·e 50% (/) e I- 0%-- B C 0 "iii (/) 100% ·e 50% (/) e I- 400nm 500nm 600nm 2 1 3 o%L_========::============== 2 400 nm 500nm 600nm Wavelength Figure 1. UV/visible spectra for three collagens for cosmetic use: (1) AteloHelogen®, (2) Collasol®, and (3) CLR Collagen® at the concentration supplied (A) and after dilution to equal concentrations of 3 mg/ml with water (B). ELECTROPHORESIS Various electrophoretic techniques are suitable for collagen analyses. These techniques are cheap and readily performed, particularly if commercially available pre-cast gels are used. In the examples, (Figures 3-5), the three different collagens for cosmetic use have been compared. Since the stain that is used to detect the collagenous components in each of the electrophoretic methods is not collagen-specific but stains all proteins, these electrophoretic methods also allow any protein contaminants (serum albumin, for ex ample) to be detected in collagen samples. In SDS-PAGE (Figure 3), the molecular weight distribution of the individual chain components after denaturation is shown. The single-chain components, the a-chains, are the fastest moving components from intact collagens. These chains show that Atelo Helogen® contains type III collagen, while this is absent from CLR Collagen®. Collasol® shows an atypical chain pattern, which also prevents assessment of any type III collagen present. None of the collagens show any significant bands moving faster than the a-chains if present, these bands could indicate degradation products, although they
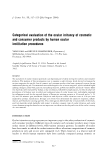
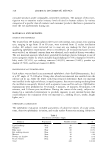
Purchased for the exclusive use of nofirst nolast (unknown)
From: SCC Media Library & Resource Center (library.scconline.org)