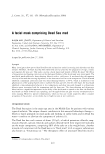
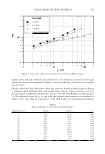
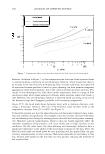
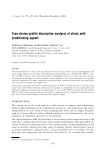
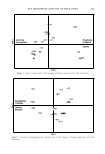
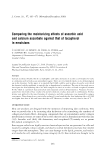
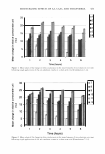
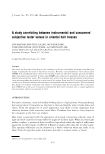
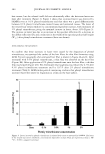
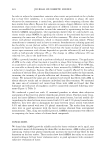
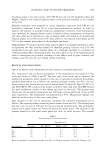
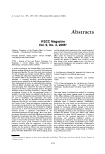
450 p 100 JOURNAL OF COSMETIC SCIENCE 4,-�===========�--------------------, 8 6 4 Facial Mask Forward measurement Backward measurement T= 5 ° C �-- -- --·-7 �,_:::.:..:::::::..�:__--_________________. T = 60 ° C 2 -+----......--------------------------------------- 4 1 6 8 10 y (1/s) 4 6 8 2 100 Figure 7. Temperature effect on the hysteresis loops of the flow curves of the facial mask. behavior. As shown in Figure 7, at low temperatures the direction of the hysteresis loops is counterclockwise, indicating an anti-thixotropic behavior, which means that there is an increase in the mud viscosity with shearing time. In some conditions, the right kind of attraction between particles of mud is given shearing can then promote temporary aggregation rather than breakdown, due to the collision of these attractive particles. This results in anti-thixotropy (18). Like other similar suspensions, there is a range of flow conditions under which shear-enhanced collisions make structure rather than break it (18). However, this anti-thixotropic behavior is relatively small (according to the size of the hysteresis loop) and disappears gradually with increasing temperature. Above 25°C, the facial mask shows hysteresis loops with a clockwise direction, indi cating a thixotropic behavior. The size of the hysteresis loops becomes wider as the temperature increases from 25° to 60 ° C (see Figure 7). It should be pointed out that the shear-thinning and thixotropic behaviors have indus trial and commercial significance. For example, since the viscosity decreases with shear rate and shearing time during the mixing process, this will lead to less power consump tion. Moreover, particle sedimentation, which in this case would negatively affect the consumer acceptance of the product, will occur slowly due to high viscosity at rest conditions. On the other hand, the shear-thinning and thixotropic behaviors have a significant importance in the ability of the facial mask to spread on the skin, where the Dead Sea mud mask can break down for easy spreading and the applied film can gain viscosity instantaneously to resist running. Newtonian materials do not behave in this way, because when spread on the skin they run very quickly, reducing the thickness of the required film.

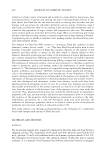
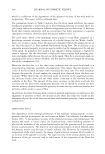
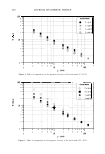
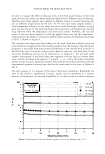
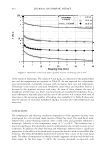
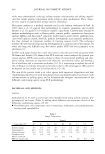
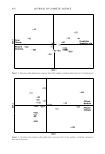
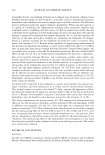
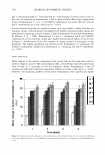
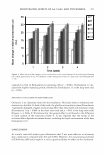
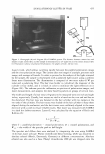
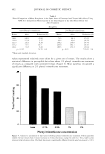
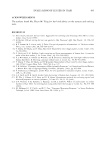
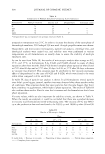
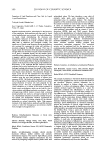
FACIAL MASK OF DEAD SEA MUD 451 In order to evaluate the effect of shearing time on the rheological behavior of the mud mask, the viscosity-shear rate relationship was determined at different times of shearing. Dead Sea mud mask samples were sheared at different values of constant shearing rate and at different temperatures for 40 min. At 5°C the mud mask samples exhibit a time-independent behavior at low shear rate and a weak thixotropic behavior at high shear rate (see Figure 8). The weak bonding between particles could explain the strength drop observed when the temperature and shear rate increase. However, the rate and extent of viscosity decay depend on both the applied shear rate and the temperature. Typical thixotropic behavior obtained at different shear rates for the Dead Sea mud mask at 45°C is shown in Figure 9. The observed time-dependent flow behavior of the mud mask was modeled using the structural kinetics approach (9). This model postulates that the change in the rheological properties is associated with shear-induced breakdown of the internal fluid structure in the Dead Sea mud. Using the analogy with chemical reactions, the final form of the structural breakdown process can be expressed as in equation 2. For all mud mask samples investigated, it was found that their apparent viscosity data at constant shear rates could be correlated with equation 2, using a = 2, i.e., with a 2nd order irreversible kinetic model. A good comparison between the model fitted results (solid lines) and the experimental apparent viscosity/time data for the mud mask can be seen in Figures 8 and 9. The rate constant, k! is a measure of the rate of thixotropic breakdown. Meanwhile the ratio of the initial to equilibrium viscosity, 11 o /TJ00 , can be considered as a relative measure of the amount of structural breakdown, or in other words as a relative measure - UI � 100 8 6 4 2 10 1 0 Facial Mask T= 5 °C i--------------------------------------------------------+ : 2.2 0 1/s i----------------------------r-------------------·-------r- t1j+ 10.211/s 5-K �el. ! _ _____ . ----1- ___ ----:- -�----,-_:_:_::_:_: : ' ' ---------- - -- - - - - - - -- - --- - - -"' ------- --- -- - - - -- - - - -- -- - - - - -1- - - - ----------- -- -- - - - - - - - - - - .. - - - - - - - - - - - - - -- -------- ---- - 5 ' ' ' ' ' ' ' ' ' 10 15 25 20 Shearing time (min) 30 35 40 Figure 8. Dependence of the facial mask's apparent viscosity on shearing time at 5 ° C.
Purchased for the exclusive use of nofirst nolast (unknown)
From: SCC Media Library & Resource Center (library.scconline.org)