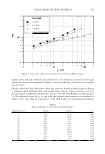
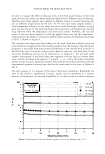
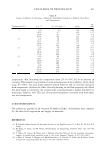
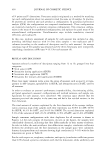
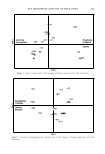
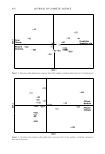
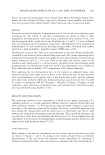
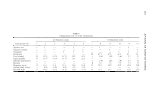
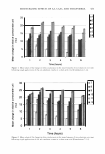
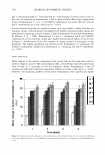
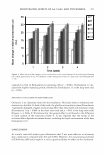
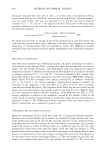
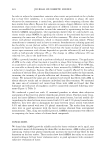
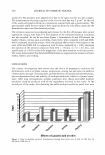
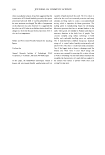
458 JOURNAL OF COSMETIC SCIENCE of N points and V dimensions. Procrustes analysis originated as a method for matching two such configurations when two assessors scored the same set of samples. In practice, M assessors are involved and each produces a configuration. In generalized procrustes analysis (GPA) the configurations are compared simultaneously. These configurations are iteratively matched to a common consensus configuration. This consensus configu ration is the mean of the transformed configurations, and replaces the panel mean of the untransformed configurations. Transformation steps include translation, rotation/ reflection, and scaling (8). In this case, replicate assessment of samples by each assessor was included as data, providing individual matrices with 18 rows (nine samples x two replicates) and V columns (according to the number of descriptors used by each assessor). An average consensus map of the samples was obtained and the three dimensions were interpreted, considering correlation coefficients � I0.5I for each assessor (9). RESULTS AND DISCUSSION Assessors selected a number of descriptors ranging from 11 to 19, grouped into four categories: • Stick aspect (ASP) • Sensations during application (SDUR) • Sensations after application (SAFT) • Sensations five minutes after application (S5MIN) There were many common terms across the group of assessors such as opacity or trans parency in ASP category, spreadability in SDUR, and absorption rate in SAFT, used by all assessors. In order to evaluate an assessor's performance (reproducibility, discriminating ability, and panel agreement), assessors' configurations and residual variances, and sample con figurations for each assessor, were considered. The consensus space showed that the assessors perceived the samples in the same way and had a low residual variance in the first dimension. The total amount of variance explained by the first dimension of the average configu ration consensus map of the samples with their repetitions was 80.9% for ASP, 50.9% for SDUR, 64.3% for SAFT, and 58.8% for S5MIN. The second dimension explained 9.2% of the variation of ASP, 20.2% of SDUR, 12.9% of SAFT, and 13.0% of S5MIN. Sample consensus configurations with their duplicates for all assessors is shown in Figures 1-4 for each category of descriptors. As seen in the figures, the samples were considerably distanced, indicating that they differ markedly in their sensory attributes. In order to define the main attributes that differentiate samples, correlation coefficients between the attributes and the first dimension in the sample space were calculated. Sensory descriptors from each assessor showing high correlation (lrl � 0.5) with the first dimension are given in Table II. For the stick-aspect set, roughness, exudation, and opacity (correlation coefficient greater than 0.88) showed a positive correlation with the first dimension, while uniformity and

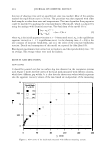
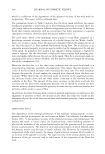
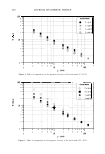
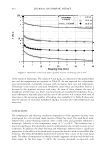
N E i5 N E i5 FCP DESCRIPTIVE ANALYSIS OF STICK BASES 459 •lA11 •A22 •C22 •C,�3 •C3 Uniformity ·C11 •A1 Roughness Homogeneity • 82 •C2 Exudative • C1 Opacity • 833 • B11 • A2. •B2� • 1 • 83 •A�33 Dim 1 Figure 1. Aspect consensus plot of the samples, including repetitions: first two dimensions. •A3 •C1 •C2 • B11 •C3 Spreadability • A2.2 •�i Coldness Oiliness •A33 •B3 Moisture •A2. • B1 82 • 83122 •A11 •C11 Dim 1 Figure 2. Sensations-during-application consensus plot of the samples, including repetitions: first two dimensions.
Purchased for the exclusive use of nofirst nolast (unknown)
From: SCC Media Library & Resource Center (library.scconline.org)