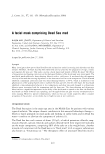
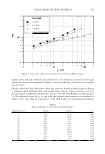
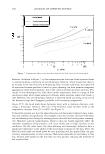
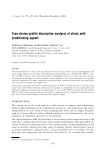
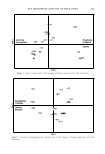
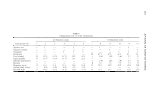
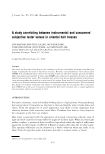
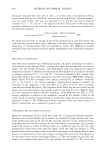
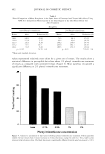
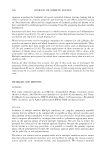
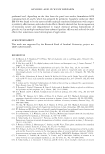
444 JOURNAL OF COSMETIC SCIENCE function of shearing time until an equilibrium state was reached. Most of the samples reached the equilibrium state in 30 min. The procedure was then repeated with other fresh samples at other shear rates and temperatures. The time-dependent flow properties could be modeled by applying the structural kinetic (SK) model, which is adopted by using the analogy with chemical reactions. The final form of the model (9) is: (2) where TJo is the initial apparent viscosity at t = 0 (structured state), T]00 is the equilibrium apparent viscosity as t ➔ 00 (equilibrium state), t is the shearing time, k = k (-y) is the rate constant of structure breakdown, and a is the order of the structure breakdown reaction. Details and assumptions of this model are reported by Abu-J dayil (9). Rheological experiments were carried out in triplicate, and the reproducibility was ± 5 % on average. The average values were used for analysis. RESULTS AND DISCUSSION FLOW CURVES It should be pointed out that no surface slip was observed in the viscometer systems used. Figure 1 shows the flow curves of the facial mask measured with different systems, which have different gap widths. It is clear that the shear stress values (which represent also the apparent viscosity values) of the mud mask are independent of the measuring 250 ----------,---------,--------,------......------ 200 150 100 so 0 Facial Mask T = 25 °C ■ M� / W ::-1- -- -1- �- -1-------1-·- - - ---i-- ___ ,_ - -!-- --+ i ■ V ! ! i • r : : : - ----- . --- ---i-------------- --------i---------------------- -----------------------i----------------------- , I I I : ----------------------:-----------------------:----------------------:-----------------------:----------------------- 40 80 120 y (1/s) 160 200 Figure 1. Flow curves of the facial mask measured with different measuring systems.

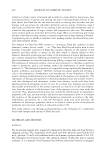
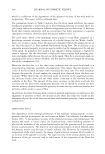
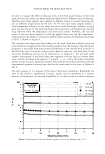
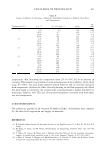
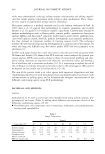
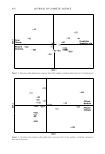
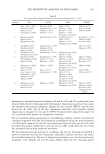
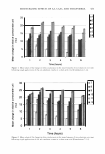
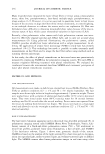
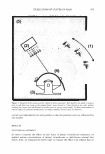
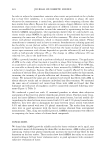
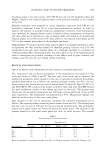
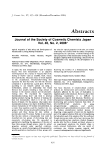
- t. 100 FACIAL MASK OF DEAD SEA MUD 445 4 ,-:::=======�==""':""::-:--�-----:-------:----:----:-�---, 8 6 4 1 Facial T = 5 °C T = 15 °C ' ' ' ---,-----.---------------,-------------- ------- ----- ---- -------------- T = 50 °C ' ' ' ' ' ' ' ' ' ' ' ' ' ' ' ' ' ' ' ' ' Hreschel-Bulkley model / j j I I I I I ---------•- --- -, ••••-•••••••••• r •••-••-• T ·----,---•,------- •••••• •-••••••••••• r-•• •- • ••• -,. ••• • • • • •-••••• I 1 I I I I I I I I I I I I I I I I I I I i I I I I I I --------------,------••--•----,----•••- -- 7---- - --------T·----------•••·I1··------•1••-•- ••••t••••---•------I 1 I I I I I I I I I I I I I I I I t I I I I I I I J I I I I I I I I I ---•·•--------�- ______ ,1. _____ _, ____ 1 ................................... L ................................. 1 ....................... L............ ____ .1 ______________ _ I I I J I I I I I I I I I I I I I I I I I I I I I I I I I I I I I I I I I I I I I I I I I I I 1 J I I I I I I I I I I l I I I I I I I I I I I -------------- -1-------- --- - --- p - - ------'1" ----- -l---- -l--------------- ♦ ------ - -- ------i- --- - - - - -I'----- ----'1" --- ---- ------ -- I I I I I I t I I I I I I I I t I I I I I I I I I I I I I I I I I I I I I I I I I I I I I I I ! I I I I I I I I I I I I I I I I I I I I I I I I I I I I I I I I I I I I I t I I I I I I I I I I I I I I I I I I I I I I I I I I I I I I I I I I I I I I I I I j I I I I I I I I 4 6 8 10 4 y (1/s) 6 8 100 Figure 2. Flow curves of the facial mask fitted to the Herschel-Bulkley model. system. Since the slip conditions encountered in a viscometer are a function of the gap width, the data points presented in Figure 1 show that the slip conditions in our system are not clear. On the other hand, the shear stress-shear rate curves of the facial mask shown in Figure 1 indicate a shear-thinning flow with yield stresses. Figure 2 shows the flow curves of the mud mask at different temperatures, fitted to the Herschel-Bulkley model (equation 1). The regressed values of T 0, m and n for the forward measurements are presented in Table I. It is clear that the parameters of the H-B model are temperature-dependent, Table I Regressed Parameters of the Herschel-Bulkley Model Temperature ( ° C) 'T 0 (Pa) m (Pa sn) n 5 40.0 11.30 0.63 10 38.0 10.43 0.62 15 35.0 9.96 0.62 20 29.5 9.17 0.62 25 30.6 14.66 0.49 30 40.7 21.92 0.38 35 60.0 25.16 0.32 40 70.0 30.34 0.22 45 67.0 29.58 0.18 so 56.1 8.34 0.42 55 54.S 7.20 0.45 60 52.3 5.53 0.45
Purchased for the exclusive use of nofirst nolast (unknown)
From: SCC Media Library & Resource Center (library.scconline.org)