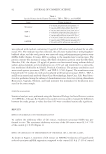
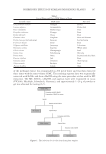
JOURNAL OF COSMETIC SCIENCE 82 FIBROBLASTS STUDIES DNA microarray. Human dermal fi broblasts were obtained from Cascade Biologics (Grand Island, NY), seeded into T-25 fl asks, and grown at 37 ± 2°C and 5 ± 1% CO2. Upon reaching confl uency, the cells were treated with Hexapeptide-11 for 24 h after which total RNA was isolated using an RNAqueous Kit (Ambion Inc., Austin, TX) per the manu- facturer’s instructions. After purifi cation, the total RNA was prepared for array use by fi rst amplifying the RNA using a MessageAmp aRNA Kit (Ambion), and then fl uores- cently labeling the aRNA with Cy3 or Cy5 using an ASAP Labeling Kit (Perkin Elmer, Boston, MA), both per the manufacturer’s instructions. To purify the fl uorescently la- beled aRNA, a microcon YM-30 fi lter column was inserted into a collection tube and fi lled with 400 μl of TE buffer. The Cy3 and Cy5 probes were combined and then added to the microcon fi lter and thoroughly mixed with the TE buffer. The fi lter was centri- fuged at 12,000 rpm for 8 min and the fl ow-through was discarded. The column was then washed twice with 400 μl of TE buffer, discarding the fl ow-through each time. After the fi nal wash, the fi lter column was inverted, placed into a new collection tube, and centri- fuged at 2000 rpm for 2 min to collect the probe. The fl uorescently labeled aRNA was applied to the DNA microarray chips (Agilent Technologies, Santa Clara, CA) and the chip was hybridized overnight and washed per the manufacturer’s recommended protocol. After washing, the microarrays were scanned with an Axon GenePix 4100A Scanner (Molecular Devices, Sunnyvale, CA) with the scanning resolution set to 5 μm and analyzed with GenePix Pro software. During the initial scan, the PMT gains for the scanner were adjusted such that the Cy5/ Cy3 image count ratios were between 0.88 and 1.12. Fluorescence intensities for the microarrays were subjected to global normalization. The total fl uorescent signal for both dyes was normalized with a correction factor that would make the ratio of total intensities for both dyes equal to one. For this study, a Cy3/Cy5 (untreated/treated) fl uorescence intensity ratio greater than 1.3 or less than 0.7 (this re- lates to a change in gene expression of at least ±30%) was used as the cutoff for up- and downregulated genes, respectively (25). In addition, the fl uorescence intensity of the gene marker had to be greater than the background intensity. Fibroblast SIPS. For the fi broblast SIPS experiment, fi broblasts were prepared in the same fashion noted above for the array work. The cells were treated for 24 h with the hexapep- tide at various concentrations between 0.01% and 2.0% except the untreated control cells which were treated only with normal cell culture media. At the end of the 24-h in- cubation, the cells were exposed to a sublethal dose of hydrogen peroxide (H2O2) (150 μM, diluted in cell culture media) for 2 h (26). Following the H2O2 exposure period, the media was removed and replaced with fresh, normal cell culture media and the cells were allowed to grow for an additional 24 h after which changes in ATM expression were as- sessed using an immunoblotting-based technique. Fibroblast intrinsic replicative senescence. Human neonatal fi broblasts were obtained after primary culture (passage 1), seeded into a set of T-75 fl asks in 3 ml/fl ask of fi broblast growth media, and grown at 37 + 2°C and 5 + 1% CO2. The cells were expanded through six passages (one passage was defi ned as growing the cells until the fl ask was confl uent and then splitting the cells 1:2, thus one passage was roughly equal to one population doubling). After the 6th pas- sage, the fi broblasts were split into different treatment groups and treated with the various test materials through passage 18. At passage 18, a portion of the fi broblasts were used to assay

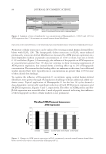
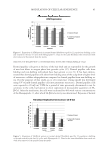
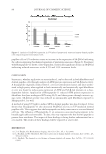
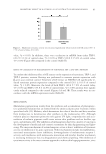
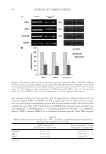
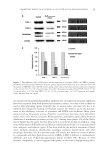
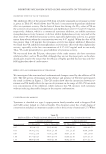
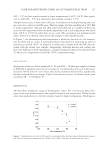
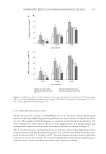
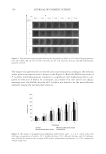
MODULATION OF CELLULAR SENESCENCE 83 changes in ATM and SA-β-Gal, while the remaining fi broblasts were cultured for an addi- tional week (approximately 2 additional passages) in the absence of test materials. For the analysis of ATM expression, at the end of the treatment period, the culture media was removed and the cells were washed once with phosphate buffered saline (PBS). After removing the wash, 1 ml of RIPA buffer (50 mM TRIS, pH 7.4, 150 mM NaCl, 1 mM PMSF, 1 mM EDTA, 5 μg/ml aprotinin, 5 μg/ml leupeptin, 1% Triton X-100, 1% so- dium deoxycholate, 0.1% SDS) was added to the fl asks and they were incubated on ice for 15 min on a rocking platform to lyse the cells. The cell lysates were then transferred to 1.5 ml tubes and centrifuged for 5 min at 14,000 rpm (4°C). The supernatant was re- tained and stored at −75°C. The protein concentration of the supernatant was determined using a BCA Protein Assay (Pierce, Rockford, IL). ATM content was then determined using an ELISA-based assay. SA-β-Gal staining. Prior to staining, the fi broblasts were washed once with PBS and then fi xed for approximately 6 min in a fi xing solution (2% formaldehyde and 0.2% glutaral- dehyde in PBS). After fi xing, the cells were washed three times with PBS and stained using a Senescent Cells Staining Kit (Sigma-Adrich, St. Louis, MO) per the kit’s instruc- tions. The cells were then incubated at 37°C overnight in a non-CO2 incubator. On the following day, the staining solution was removed and replaced with PBS. The cells were then photographed microscopically, and the number of stained cells (SA-β-Gal positive) in each fi eld was counted. Dermal papillae studies. Human dermal papillae cells were seeded into 12 plates in dermal papillae growth well medium (DPGM) and grown at 37 + 2°C and 5 + 1% CO2 until confl uent with a media change every 48 to 72 h as needed. Once the cells were confl uent, the cell culture media was replaced with PBS and the cells were irradiated with 20 mJ/cm2 UVB. After the UVB irradiation, the PBS was removed and replaced with cell culture media supplemented with the various test materials. Nonsupplemented DPGM was used as the untreated control. In addition, one set of cells was not exposed to UVB and served as the non-UVB treated control. After the addition of the media, sets of cells were cul- tured for 48 h. At the end of the incubation period, the cells were assayed for changes in SA-β-Gal activity as described above. Statistical analysis. Treatments were compared via an ANOVA with a subsequent post hoc analysis (Newman–Keuls Multiple Comparison) using Graphpad Prism Software. Statis- tical signifi cance was set at p 0.05. RESULTS AND DISCUSSION GENOMIC RESPONSE OF HEXAPEPTIDE-11 ON NORMAL HUMAN FIBROBLASTS The purifi ed hexapeptide was initially examined for cytotoxic effects on normal human dermal fi broblasts. No cytotoxic effects were noted up to 1.0% of hexapeptide treatment (data not shown). Hexapeptide-11 was then evaluated at 0.001% and 1.0% concentra- tions on normal human dermal fi broblasts for 24 h by gene microarray analysis to deter- mine the biological effect that Hexapeptide-11 has ATM gene expression (Figure 2). Both concentrations demonstrated statistically signifi cant reductions in ATM gene ex- pression as shown by their corresponding ratio of medians being less than 0.7 (25).
Purchased for the exclusive use of nofirst nolast (unknown)
From: SCC Media Library & Resource Center (library.scconline.org)