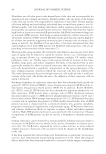
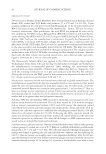
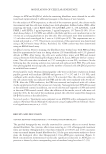
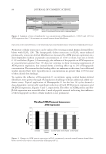
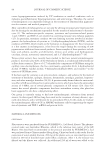
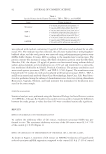
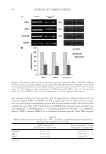
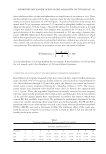
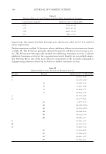
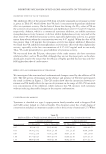
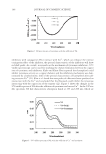
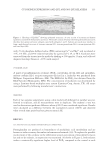
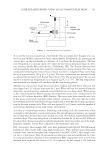
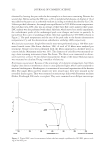
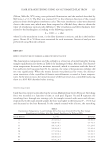
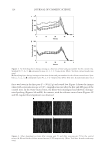
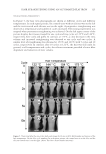
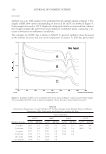
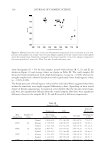
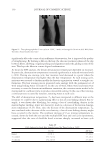
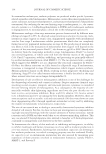
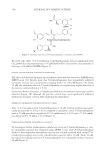
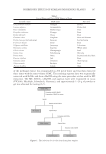
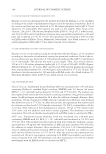
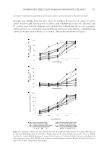
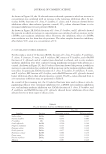
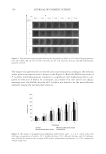
JOURNAL OF COSMETIC SCIENCE 126 DSC DATA Multiple iron cycles. DSC analyses were performed for the samples shown in Figure 5. Ex- amples of DSC fl ow curves corresponding to tresses A, B, and C are shown in Figure 6. Curly sample A treated at 122°C displayed a sharp peak similar to untreated hair, whereas the straight samples (B and C) had much shallower endotherm peaks, indicating a de- crease of α-keratin microfi lament crystallinity. The complete set of DSC data is shown in Table II. In general, enthalpy values decreased as the number of cycles and iron cycle temperature increased. Td shift was quite small Figure 6. Examples of DSC curves of samples A, B, and C shown in Figure 5 and an untreated hair sample. For each sample two DSC curves (2 pans) are displayed. {Note: Test data. Actual results may vary.} Table II Denaturation Temperature, Td, and Enthalpy, ΔH, for Hair Samples Ironed Multiple Times at Different Temperatures (Hair Temperature was Probed at 1 cm above the Iron) Number of cycles Cycle temperature 122°C 144°C 154°C 175°C Td (°C) ΔH (J/g) Td (°C) ΔH (J/g) Td (°C) ΔH (J/g) Td (°C) ΔH (J/g) 2× water 172.7 5.3 173.7 5.7 173.2 4.7 169.9 4.8 2× silicone 173.5 5.0 173.7 5.7 173.6 5.4 168.0 2.0 5× water 173.7 3.7 172.7 3.4 173.1 2.8 5× silicone 174.2 4.3 173.0 3.6 172.8 2.6 10× water 174.4 2.8 172.9 3.6 10× silicone 174.0 4.3 172.0 3.6

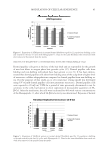
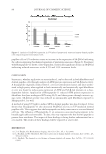
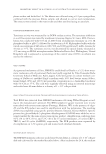
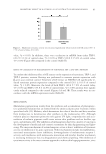
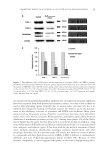
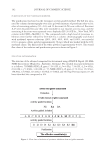
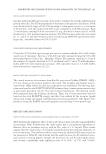
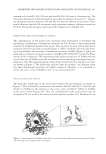
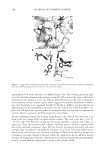
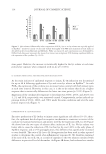
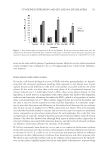
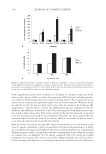
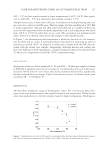
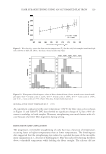
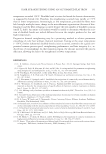
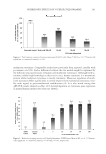
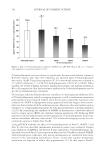
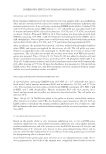
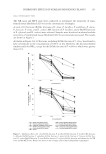
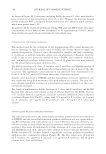
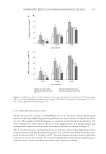
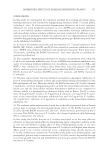
HAIR STRAIGHTENING USING AN AUTOMATED FLAT IRON 127 (ΔT ~ 1°C) for hair samples treated at lower temperatures (144°C–154°C). But signifi - cant Td shift (ΔT ~ 6°C) was observed in hair samples ironed at 175°C. Multiple heat/cool cycles in high-volume DSC pan. A simulation of multiple heating and cool- ing cycles was conducted in DSC pans. The hair sample was fi rst equilibrated at 58% RH at room temperature. The pan was then sealed and subjected to a number of heat/cool cycles at low temperature before the fi nal temperature scan. Cycle temperature was varied from 120°C to 170°C for either three or six cycles. The experiment was performed with ethnic Afro hair to identify more clearly the changes in the endotherm peak. In Figure 7, the denaturation peak temperature is plotted as function of cycle tempera- ture for three and six cycles. A nonlinear behavior was observed, indicating an onset of transition at around 140°C. In Figure 8, a similar plot is shown with the DSC data ob- tained with the ironed tress samples. Surprisingly, although heating and cooling rate were very different in both experiments, a similar nonlinear behavior was observed with Td, when cycle temperature reached the 150°C temperature range. WET ELASTICITY Average wet elasticity of hair samples B, C, D, and E (N ~ 50 fi bers per sample) is shown in Table III. A signifi cant decrease of wet elasticity was observed as iron cycle temperature increased. On the basis of t-test values, the silicone treatment did not affect signifi cantly the heat-induced elasticity change. A plot of wet elasticity versus Td showed a quite good correlation (R2= 0.76) (Figure 9). BIREFRINGENCE The hair fi bers displayed a range of birefringence values. For a 90 microns fi ber, blue- green colors were predominant in the samples treated at low temperature. Yellow-brown colors were predominant in the hair samples treated at higher temperatures. Birefringence Figure 7. Multiple heat/cool cycles in DSC pans for an untreated ethnic afro hair sample: Denaturation tempera- ture (Td) as a function of temperature for 3 and 6 cycles. {Note: Test data. Actual results may vary.}
Purchased for the exclusive use of nofirst nolast (unknown)
From: SCC Media Library & Resource Center (library.scconline.org)