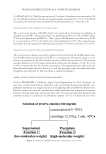
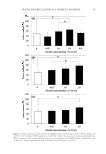
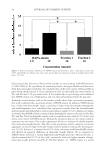
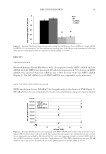
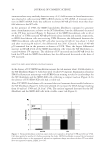
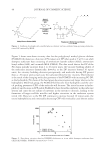
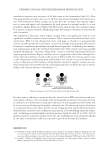
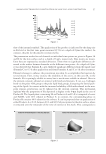
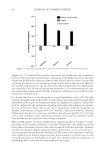
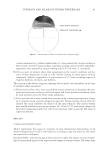
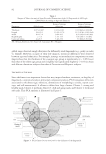
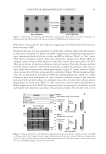
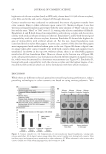
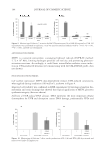
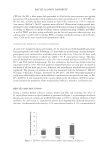
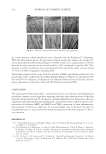
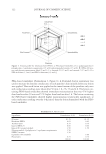
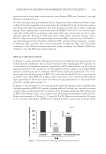
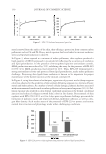
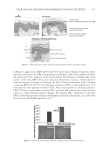
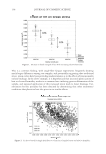
DETERMINATION OF BAC IN WET WIPES 3 length purchased from Agilent and the effective length of the column was 38.5 cm. The wavelength selected was 214 nm, due to the maximum absorption in spectrums obtained by the DAD detector of the CE system. The capillary was thermostatically controlled at 18°C during all experiments. The background electrolyte (BGE) was 75 mM (pH 6) phos- phate buffer mixed with ACN at a ratio of 70:30. A washing program was applied for new capillaries through the following steps: fl ushing with 1.0 M NaOH (20 min), fl ushing with 0.1 M NaOH (20 min), and fl ushing with water (20 min). After activation of the column, a short washing procedure was applied for each working day by fl ushing 1.0 M NaOH (20 min). Besides these washing steps, the capillary was conditioned by fl ushing with 1.0 M NaOH (1.5 min), 0.1 M NaOH (1.5 min), water (3 min), and BGE (5 min) between each measurement. After the conditioning step, samples were injected hydrodynamically by using 50-mbar pressure for 3 s at the ca- thodic end of the capillary and separation was carried on by applying +10 kV separation voltage. At the end of the measurement, the capillary was rinsed with methanol for 3 min to fl ush all residues from the capillary. Stock solution of BAC was prepared by dissolving weighed amount of the standard sub- stance in methanol at a concentration value of 5 mg/ml BAC. Standard solutions were obtained by diluting stock solution with methanol. According to the certifi cate of analysis, BAC standard consists of C10 derivative (65.4%) and C12 derivative (32.8%). Calculations to determine concentration of each species in standard solutions were made based on this information. Quality control solutions of BAC were prepared as standard solutions at dif- ferent concentration values from calibration curve points. Low, medium, and high con- centration values were selected as 0.0075, 0.06, and 0.2 mg/ml BAC. All solutions were stored in a refrigerator at 4°C. Wet wipe solutions were used without any sample treatment for analysis. For this pur- pose, fi ve wet wipe tissues were taken from the packet and were wrung out to obtain a solution containing BAC. This solution (100 μl) was diluted by the addition of 1400 μl of methanol. After the diluting step, this solution was injected to the capillary column for analysis. ADSORBED AMOUNT OF BAC ON WIPE TISSUES Although these studies were performed, it was understood that wipe tissues adsorbed a part of BAC included in wetting solution. A set of experiment was designed to reveal the adsorbed amount of BAC onto the tissues as three repetitive, three different sets. For this purpose, dry tissue samples were wetted by using a solution containing 0.1% BAC in ratio of 2.80 (w/w). This application is used to moisture the dry wet wipes in commercial products in industrial area. After wetting of dry tissues, they were kept at room temperature for a week. Then fi ve wet wipes were wringed and 100 μl of obtained solution is diluted by adding 1400 μl methanol. Fifteen different solutions were obtained by this way due to repetitions and all solutions were used directly for measurement. Adsorbed amount of BAC was calculated by comparing measured amount with total BAC amount. It was seen that dry wipes adsorbed a big amount of BAC species that measured C10 value was 85.64% ± 9.68% of added amount and measured C12 value was 67.06% ± 9.68% of added amount. The percentage of the adsorbed amount of BAC was used to analyze BAC in the solution of wet wipes.

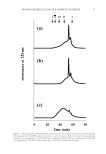
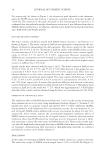
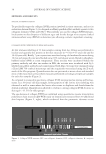
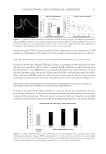
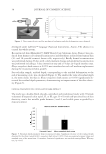
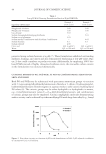
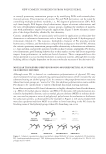
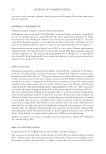
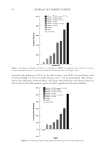
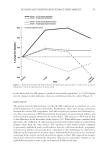
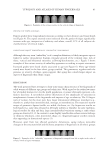
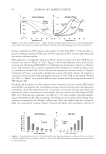
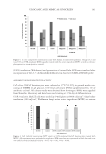
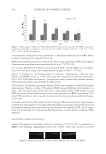
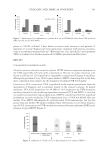
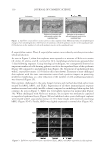
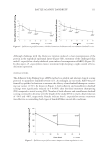
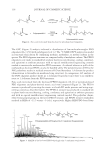
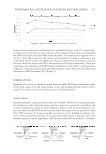
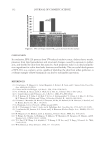
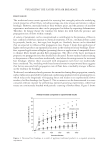
JOURNAL OF COSMETIC SCIENCE 4 RESULTS AND DISCUSSION OPTIMIZATION OF CE CONDITIONS Different buffer solutions such as acetate and phosphate buffers were tried to monitor BAC. According to the certifi cate of analysis of BAC standard, it contains two types of BAC with C10 and C12 derivatives. Due to this situation, two peaks were observed during analysis of standard material and these peaks were investigated simultaneously. When the buffer solution was selected, obtained peaks, shape of peaks, and also peak areas were compared. Phosphate buffer solution was selected as supporting electrolyte after comparing the ob- tained results. A set of experiments was carried out to optimize electrolyte concentration using 25, 50, 75, 100, 200, and 300 mM phosphate buffer as supporting electrolyte. All electrophoregrams, obtained peaks, peak shapes, and peak area values were compared. There was no peak at a concentration value of 300 mM. Hence, obtained electrophoregrams were investigated for other concentration values. Since regular peak shapes were observed, only peak area values were used to compare electrophoregrams versus supporting electrolyte concentration. Peak area values increased with increasing buffer concentration up to 75 mM. However, area values decreased at higher buffer concentrations. For analytical purposes, 75 mM concentration value was selected as phosphate buffer concentration value due to the high- est peak area value. pH is very important parameter for CE. Because the pH value of supporting electrolyte solution changes the capillary inner wall, it provides power of the separation system: elec- troosmotic fl ow. Effect of pH value on determination of BAC was investigated between pH 5 and 8 values. Peaks of C10 and C12 derivatives closed up with increasing pH value. It means that pH value of phosphate buffer solution was effective on resolution of peaks. Beside the peak shape, peak area values were compared and it was seen that the highest peak area value were obtained at pH 6 buffer solution. pH 6 value was selected as sup- porting electrolyte pH value. Temperature affects the mobilities of the substances and also analysis. Different temperature values were investigated by comparing obtained electrophoregrams between 18° and 28°C. It was seen that peak area values decreased when temperature increased to 24°C. But, peak areas increased with increasing temperature after this value. The mean higher temperature values could be selected, but in this situation, Joule effect affecting separation quality cannot be eliminated. As expected, repeated experiments showed that there was a repeat- ability problem at higher temperature values. Thus, low temperature values were more appropriate. Due to all these reasons, 18°C was selected as the working temperature. Starting experiments showed that usage of only buffer solution did not achieve the sepa- ration of BAC species. Consequently, an organic additive was necessary to perform analy- sis. First of all, methanol was tried as organic additive, but remarkable results were not obtained, then another solvent ACN was tried. Due to separation of both BAC species, different ACN percentages were investigated between 10% and 60% and recorded elec- trophoregrams were evaluated. The separation of the peaks was not satisfactory at low ACN percentages of up to 30% due to shapes of the peaks. Peak shapes and peak resolu- tions were better at a ACN percentage of 30%. But the resolution value deteriorated with increasing ACN percentage. For these reasons, ACN percentage of 30% was selected to determine BAC.
Purchased for the exclusive use of nofirst nolast (unknown)
From: SCC Media Library & Resource Center (library.scconline.org)