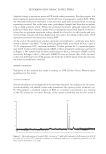
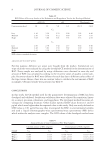
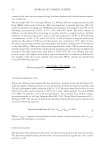
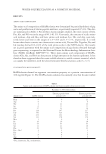
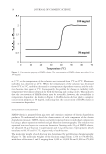
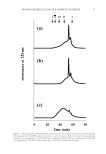
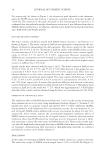
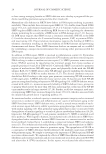
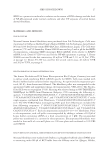
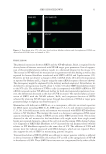
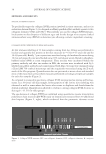
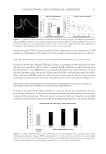
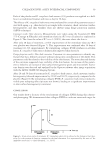
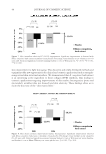
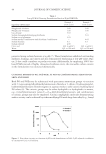
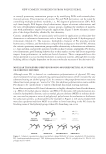
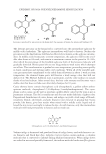
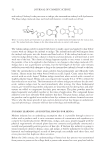
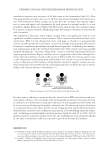
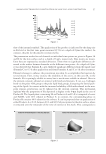
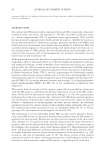
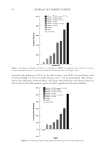
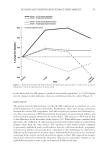
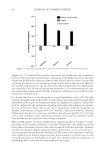
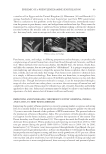
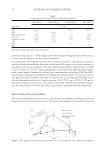
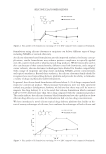
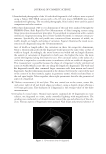
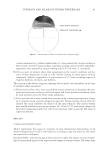
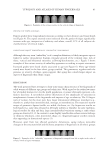
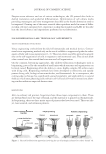
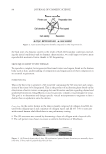
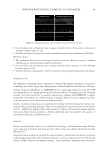
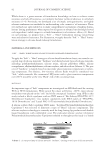
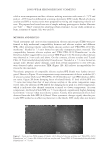
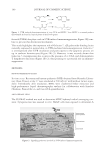
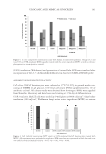
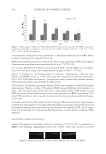
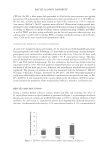
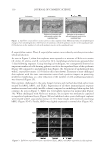
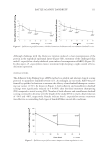
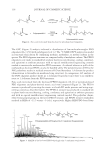
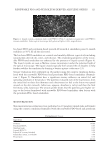
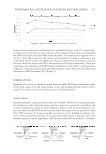
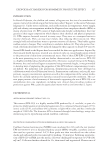
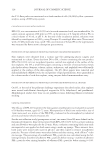
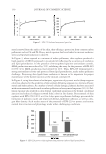
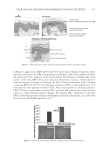
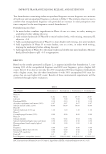
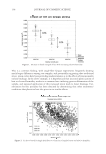
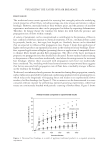
JOURNAL OF COSMETIC SCIENCE 56 of actives in the stratum corneum. Specifi c interactions between SA and the matrix may also be important. MATERIALS AND METHODS Volunteers signed informed consent before participation. All formulae tested contained 2% SA. Products tested included a treatment cream (Prod- uct A), an alcohol-based gel cream (Product B), and a liquid toner (Product C). Eight microliters of either Product A or B was used. In the case of liquid Product C, 20 μl was used. These dosages resulted in a total deposition of SA at the surface of Product A (0.12 mg/cm2) and Product B (0.11 mg/cm2), and, for the liquids (Product C), 0.14 mg/cm2. Spectra were acquired using a RiverD gen2-SCA in vivo confocal Raman spectrometer, equipped with a 785-nm laser source. Laser power was 20 mW. The acquisition time for each spectrum was 5 s. The step size for depth profi les was 2 (Product C) or 3 μm (Prod- ucts A and B). Each depth profi le was recorded in triplicate at each time point and aver- aged for each volunteer (see below). DATA ANALYSIS Normalized intensities as illustrated in Figure 2A and B were calculated by dividing a peak area of an SA band by an internal intensity standard. SA exhibits an aromatic ring- breathing mode near 1040 cm-1. This spectral feature was chosen because it is not shifted by the ionization state of SA and is sharp, intense, and well defi ned. Internal intensity standards are used to compensate for differences in intensity arising from experimental variables such as laser power, optical contact, and skin tone. One of these, used for For- mulae A and B, is the ring-breathing mode of phenylalanine at 1000 cm-1. The second, used to evaluate the liquid astringent Formula C, is the protein Amide I mode near 1650 cm-1. The use of Amide I for Formula C was preferred due to a spectral overlap of ingredients with the phenylalanine band. To estimate the fraction of SA present in a given depth, the differences of the above ratios from the corresponding ratio at baseline were fi rst calculated at each depth and time point. As depth profi les were recorded in triplicate, the baseline ratios were averaged before the differences from baseline were calculated. The differences from baseline for each time point and depth was averaged across volunteers. For a given depth profi le, the differences from baseline were summed over the depths sampled. The sum represents all SA. The fraction of SA at a given depth was then the ratio of the dif- ference from baseline at a given depth to the sum of differences from baseline. Analysis of variance was used to establish statistical signifi cance (Minitab™, Minitab, Inc., State College, PA). RESULTS AND DISCUSSION A representative in vivo Raman penetration profi le is shown in Figure 1. The responses of the band ratio of the SA band to that of Phe are shown in Figure 2A and B for a placebo and a SA-containing formula, respectively. The ratios are mapped out by the response surfaces, for which the x is depth, y time, and z the ratio of the SA band to

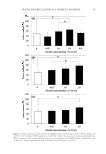
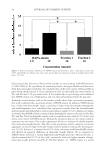
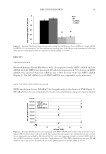
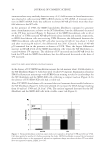
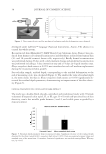
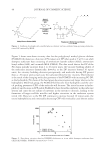
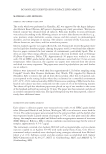
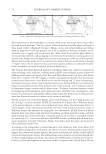
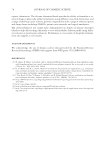
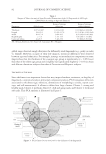
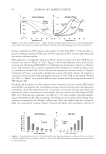
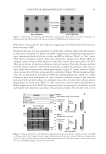
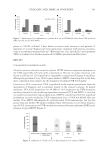
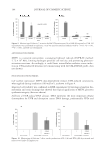
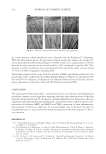
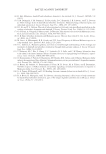
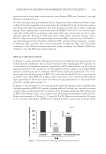
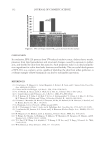
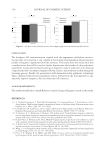
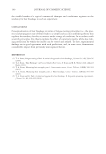
RAMAN SPECTROSCOPIC INVESTIGATION OF SALICYLIC ACID PENETRATION 57 that of the internal standard. The application of the product is indicated by the sharp rise in SA level at the fi rst time point measured (0.5 h) at a depth of 0 μm (the surface). In contrast, the plot for the placebo is relatively fl at. The penetration results for each formula at individual time points are given in Figure 3A and B for the skin surface and at a depth of 6 μm, respectively. Data points are means. Error bars are expressed as standard deviation. There were no signifi cant differences ob- served at the surface between formulae at the different time points. At a depth of 6 μm, it was observed that Formula B, a gel, exhibited signifi cant differences from the liquid toner (Formula C) at 0.5 h after application and from Formulae A and C at 4 h after treatment. Ethanol is known to enhance the penetration into skin. It accomplishes this function by several means. First, it may increase the solubility of the active, in this case SA, in the formula. SA is sparingly soluble in water, but is much more soluble in ethanol. Once in the stratum corneum, ethanol can interact with lipids and proteins. It can, e.g., hydrogen bond via the polar -OH group to the polar lipid head groups, disrupting the lateral pack- ing of the lipids. In concert with the increased solubility of SA with ethanol in the non- polar regions, penetration can be enhanced in the stratum corneum. This mechanism explains why the proportion of SA deposited is higher at the 6-μm depth in the case of Product B. The liquid phase containing SA in Products A and C–E is composed of water and NaOH, with 10% ethanol in Product C in contrast, the corresponding phase in Product B contains 40% ethanol as the solvent. It can be proposed that on application of either Products A or C–E, between 63% and 80% SA precipitated at the skin surface, where it remained over the remainder of the time of interest in this work. This corresponds to Figure 1. Figure 2.
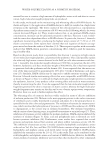
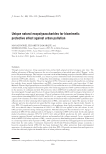
Purchased for the exclusive use of nofirst nolast (unknown)
From: SCC Media Library & Resource Center (library.scconline.org)