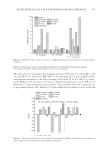
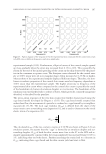
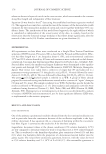
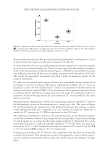
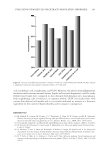
JOURNAL OF COSMETIC SCIENCE 176 relates to about six layers of cuticle in the cross-section, which are assumed to be constant along fi ber length and independent of fi ber diameter. Equation (9) was fi tted to the G″ data using the established nonlinear regression method (3). This approach accounts for a certain fraction of the variance of the data and also yields estimates for the torsional loss moduli of cortex and cuticle together with their 95% con- fi dence limits. The justifi cation of this model-based approach, the applicability of which is considered as independent of the actual scatter of the data, is, namely, based on the observation that the torsional storage modulus of hair fi bers drops signifi cantly after the removal of the cuticle (10). Further considerations are given elsewhere (3). EXPERIMENTAL All experiments on hair fi bers were conducted on a Single Fiber Torsion Pendulum apparatus (TRI Princeton, Princeton, NJ) as described by Persaud and Kamath (4). Effec- tive hair fi ber length was 3 cm, frequency about 0.1 Hz, and environmental conditions 22°C and 22% relative humidity. All tests and treatments were conducted on dark brown, commercial, Caucasian hair (International Hair Importers & Products Inc., Glendale, NY). For each fi ber tested, the smallest and largest diameters were determined at fi ve equidis- tant points and through 360° (Laser Scan Micrometer, LSM-500, Mitutoyo, Kanagawa, Japan). Hair tresses were taken from a collective of virgin hair (V) and subjected to a permanent waving treatment (7% thioglycolic acid, pH 9.5, 30 min) followed by reoxi- dation (2.2% H2O2, pH 4). This was followed by bleaching (8% H2O2, pH 9.4, 30 min). The perm-waved and bleached sample is referred to as WB. A group of fi bers already prepared for torsional testing was furthermore treated with a commercial “repair” shampoo (30 min and 30 s rinse). The sample is referred to as WBS. For further, specifi c details the reader is referred to Wortmann et al. (3). Data analysis and nonlinear curve fi ts were conducted using Statistica (Version 13, Dell, Tulsa, OK) and SPSS (Version 20, IBM, Armonk, NY). Homogeneity or in-homogeneity of data sets was determined by analysis of variance (ANOVA) and nonconservative, post hoc least signifi cant difference (LSD) tests, as implemented in the statistics programs. RESULTS AND DISCUSSION BASIC OBSERVATIONS One of the primary experimental variables obtained from the free torsional oscillation test and in particular from the continuous decrease of the oscillation amplitude is the loga- rithmic decrement Λ [see equation (4)], as a measure of damping within the viscoelastic hair fi ber. Figure 1 summarizes the results for Λ for the three samples. Logarithmic decrement values at the chosen conditions (22% relative humidity, 22°C) are low compared to literature values for wool (14) and hair (12) at 65% relative humid- ity. This is attributed to the humidity-dependent glass transition of wool (15) and hair (16), where low humidity sh ifts the properties of a keratinous material further into the glassy region. The values show satisfactory agreement, however, with the values for wool at 25% relative humidity and T 30°C of Λ 0.06 (17). Also reasonable agreement is

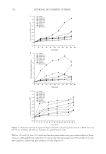
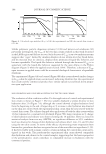
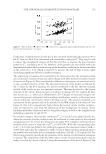
THE TORSIONAL LOSS MODULUS IN HUMAN HAIR 177 observed with the values for hair given by Persaud and Kamath (4) and Harper et al. (11) as well as from other sources on the basis of equation (5) (18–20). Λ values drop after the waving and bleaching treatment compared to virgin hair, signify- ing a decrease of internal energy loss. Values increase again after the shampoo treatment. In line with the qualitative impression from Figure 1, ANOVA as well as LSD tests show that differences between all data sets are highly signifi cant well beyond the 95% level. The results for logarithmic decrement thus show a high discriminative power for the cosmetic treatments. G″ values are determined with equation (8) from the individually obtained values for Λ (see Figure 1) and G′ (see Figure 2B) and are summarized in Figure 2A. G″ values are roughly by a factor 50–100 smaller than G′, which is in agreement with observations by dynamic mechanical analysis (DMA) (19) and attributed to the general properties of hair as a glassy polymer well below its glass transition (16) under the conditions of the mea- surements. In line with expectations for such a material, G″ increases when G′ decreases and vice versa (21). Moving from the experimental variable Λ to the primary, physical variable G″, much of the discriminative power of the measurement of energy loss is lost. The insets in Figure 2A and B summarize the signifi cance of the differences between the samples, as deter- mined through the LSD test. Compared to G′, the number of signifi cant differences is smaller for G″, leaving only V WB as signifi cant on the 95% level. This difference of performance and loss of discriminative power are attributed to compen- sation effects between values for the storage and the loss modulus, respectively. Plotting G″ and Λ against G′, as is done for the virgin sample in Figure 3, shows that the correla- tion between Λ and G′ is only faint though signifi cant (r2 = 0.08), while it is quite pro- nounced for G″ (r2 = 0.69). Similar observations were made for G″ versus G′ for the WB (r2 = 0.74) and the WBS sample (r2 = 0.77), respectively. Underlying the analysis for G″ above is the assumption that the data are essentially normally distributed. This assumption seems to be apparently correct, when inspect- ing the cumulative probability plots of the data, which all provide adequate straight lines. Figure 1. Summary of data for the logarithmic decrement Λ for the three samples. Data are given as means ( ), standard errors (SE) (boxes), and limiting values for the 95% confi dence range (1.96 × SE: whisker). Differences between all data sets are highly signifi cant on the 95% level.
Purchased for the exclusive use of nofirst nolast (unknown)
From: SCC Media Library & Resource Center (library.scconline.org)