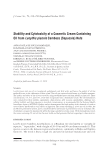
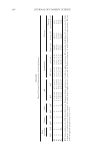
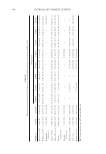
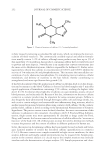
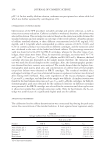
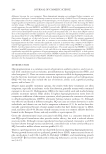
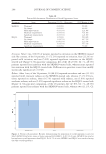
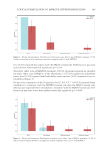
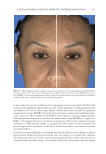
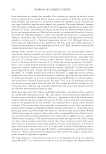
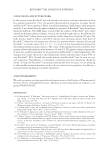
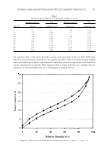
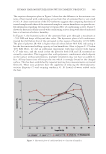
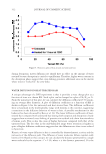
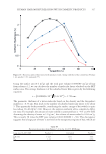
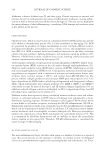
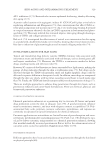
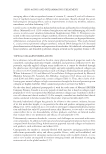
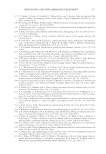
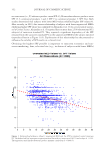
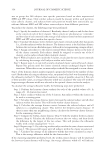
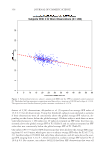
JOURNAL OF COSMETIC SCIENCE 352 ent sunscreens (i.e., P3 reference product: mean SPF 4.5 Homosalate reference product: mean SPF 15.5 commercial products 1 and 2: SPF 15+ commercial product 3: SPF 30+). Both studies determined that subjects with lower MED values exhibited higher SPF values (4). More recently, in 2019, this inverse relationship of subjects with lower unprotected MEDs exhibiting higher SPF values was confi rmed by Alejandria et al. (5). In a recent article in Jour- nal of Cosmetic Sciences, Alejandria et al. (5) reported data on more than 2,500 observations (652 subjects) of sunscreen standard P2. They reported a signifi cant dependency of the SPF obtained from the sunscreen standard P2 on the unprotected MED of the subject reported (reproduced herein as Figure 1) (5). Exploitation of this relationship has the potential to infl uence the validity of SPF results in a clinical trial. Obtai ning the highest SPF possible is important to sunscreen economics and sun- screen marketing thus, selection bias (e.g., inclusion of subjects with lower MEDs) F i gure 1. Relationship between a subject’s unprotected MED and the SPF for standard control sunscreen P2. The dashed red line represents a regression trend line with a y intercept of 18.579 and a slope of -0.155. The regression trend line has Pearson’s product moment correlation of -0.409 (5).

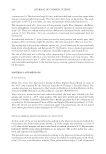
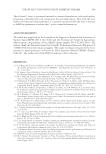
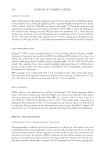
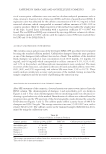
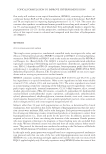
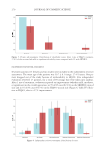
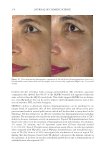
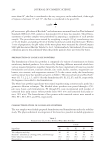
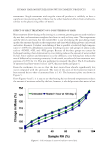
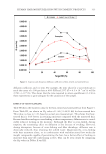
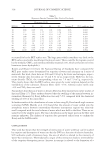
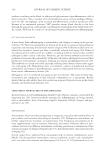
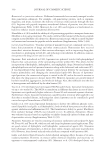
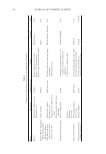
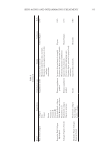
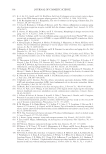
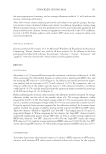
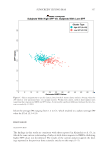
SUNSCREEN TESTING BIAS 353 would infl uence the validity of a clinical trial to determine the SPF of a sunscreen (e.g., higher SPF values obtained). Subversion bias would occur if subjects who be- come known for always generating a low SPF value for the test sunscreen are ex- cluded from future clinical trials. Similarly, subjects who become known for always generating a high SPF value might be asked to be on clinical trials. Because of the volume of observations in the data reported by Alejandria et al. (5), one might be able to discern if such individuals existed. MATER IALS AND METHODS STUDY DESIGN The 2 ,503 observations (n = 652 subjects) depicted in Figure 1 (5) were analyzed for multiple observations on the same subject. After including only those subjects with three or more observations each, the resulting subset of data (Figure 2) consisted of 2,033 observations encompassing 286 subjects (average of seven observations per subject). The average of all observations for each of the 286 subjects’ unprotected MEDs and corresponding SPF values was calculated to provide a single data point for each subject. The relationship of unprotected MED and corresponding SPF was statis- tically explored in this dataset. STATI STICAL ANALYSIS To te st if the consolidation of the 2,033 observations across subjects reduced any statistical power or changed the conclusions reported on the original dataset of 2,503 observations, a linear regression and correlation analysis were performed using the same parameters presented in Alejandria et al. (5). To te st for any patterns in the data, a k-means cluster analysis approach was used (6). The goal of the cluster analysis Figure 2. Study design.
Purchased for the exclusive use of nofirst nolast (unknown)
From: SCC Media Library & Resource Center (library.scconline.org)