350 JOURNAL OF COSMETIC SCIENCE
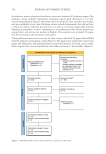
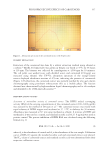
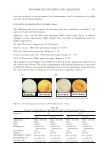
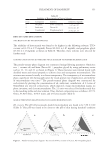
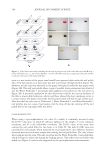
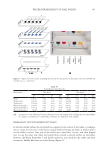
Construction of pseudo-ternary phase diagram to prepare ketoconazole loaded microemulsion. The
pseudo-ternary phase diagram was constructed using ternary plot software (TernaryPlot.
com) and the microemulsion region was located.7 Solvents that exhibited the maximum
solubility of ketoconazole were selected for preliminary study: Omix (Omix-TTO and
coconut oil at weight ratios of 1:1, 1:2, and 2:1) and Smix (Tween 80 and propylene glycol
at weight ratios of 1:1, 1:2, and 2:1). The above solutions were titrated in distilled water (0.5
to 10 mL) with gentle stirring at 37 ± 0.5°C. The clarity and consistency of the mixtures
were observed visually after the addition of water. Next, a clear, transparent, and yellowish
color mixture assured the formation of microemulsion. Lastly, the microemulsion region
was plotted at a ternary phase diagram using weight percentages of the water, oil, and
surfactant phases. Finally, the above microemulsions were kept at room temperature for 48
hours to check for any phase separation.1
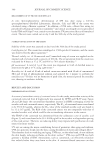
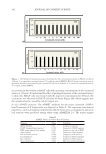
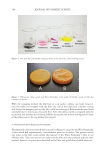
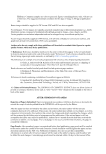
Composition of microemulsion. As ketoconazole is poorly water soluble, larger amounts of
oil and surfactant phase were used than water phase to formulate microemulsion. This
ratio was selected from the phase diagram. The combination of the ketoconazole loaded
microemulsion is shown in Table I. The microemulsion was prepared as follows: oil and
surfactant phases were homogeneously mixed, and ketoconazole was completely dissolved
in it using a magnetic stirrer.14 Next, sodium benzoate was added in water phase and
mixed with the above oil-surfactant-ketoconazole solution using a magnetic stirrer. The
best composition was 45.77% Omix, 43.82% Smix, 10.41% water, and 2% ketoconazole
(Table I).
CHARACTERIZATION OF MICROEMULSION
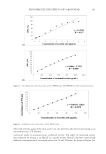
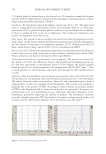
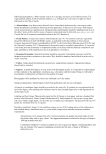
Viscosity and pH. Viscosity of the microemulsion was measured using a LVDVE Brookfield
digital viscometer (Brookfield Engineering Corporation, Massachusetts, USA). The sample
was filled in a suitable container and was subjected to the viscometer. The spindle number
64 was attached to the viscometer and then lowered into container, until dipping to the
till mark on the spindle shaft and was then run at 50 rpm. The pH was determined with a
digital pH meter (Labman Scientific Instruments Pvt. Ltd., Tamil Nadu, India) that used
a glass electrode at room temperature.4
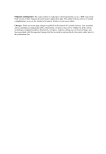
Determination of cloud point. Cloud point is the temperature at which transparent
microemulsion become cloudy and phase separation starts.15 It was conducted as follows:
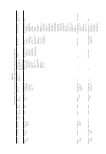
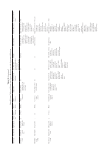
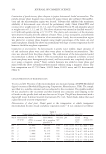
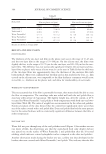
Table I
Composition and Characterization of Ketoconazole Loaded Microemulsion (2:1)
Batch Ketoconazole
(%w/w)
Omix
(TTO +coconut)
(2:1)
Smix (Tween
80 +propylene
glycol) (2:1)
Viscosity
(cp)
pH Cloud
point
(°C)
Drug
content (%)
F1 2 8.744% 10.65% 154 5.32 ± 0.21 53 ± 0.4 84% ± 0.02
F2 2 45.77% 43.82% 958 5.56 ± 0.20 82 ± 1.1 89% ± 0.03
F3 2 19.40% 41.17% 635 5.52 ± 0.34 73 ± 0.7 85% ± 0.01
F4 2 3.88% 8.97% 102 5.30 ± 0.18 51 ± 1.5 33% ± 0.03
F5 2 50.44% 25.46% 249 5.75 ± 0.09 57 ± 0.3 75% ± 0.01
F6 2 30.03% 25.17% 457 5.43 ± 0.16 54 ± 1.3 64% ± 0.04
Construction of pseudo-ternary phase diagram to prepare ketoconazole loaded microemulsion. The
pseudo-ternary phase diagram was constructed using ternary plot software (TernaryPlot.
com) and the microemulsion region was located.7 Solvents that exhibited the maximum
solubility of ketoconazole were selected for preliminary study: Omix (Omix-TTO and
coconut oil at weight ratios of 1:1, 1:2, and 2:1) and Smix (Tween 80 and propylene glycol
at weight ratios of 1:1, 1:2, and 2:1). The above solutions were titrated in distilled water (0.5
to 10 mL) with gentle stirring at 37 ± 0.5°C. The clarity and consistency of the mixtures
were observed visually after the addition of water. Next, a clear, transparent, and yellowish
color mixture assured the formation of microemulsion. Lastly, the microemulsion region
was plotted at a ternary phase diagram using weight percentages of the water, oil, and
surfactant phases. Finally, the above microemulsions were kept at room temperature for 48
hours to check for any phase separation.1
Composition of microemulsion. As ketoconazole is poorly water soluble, larger amounts of
oil and surfactant phase were used than water phase to formulate microemulsion. This
ratio was selected from the phase diagram. The combination of the ketoconazole loaded
microemulsion is shown in Table I. The microemulsion was prepared as follows: oil and
surfactant phases were homogeneously mixed, and ketoconazole was completely dissolved
in it using a magnetic stirrer.14 Next, sodium benzoate was added in water phase and
mixed with the above oil-surfactant-ketoconazole solution using a magnetic stirrer. The
best composition was 45.77% Omix, 43.82% Smix, 10.41% water, and 2% ketoconazole
(Table I).
CHARACTERIZATION OF MICROEMULSION
Viscosity and pH. Viscosity of the microemulsion was measured using a LVDVE Brookfield
digital viscometer (Brookfield Engineering Corporation, Massachusetts, USA). The sample
was filled in a suitable container and was subjected to the viscometer. The spindle number
64 was attached to the viscometer and then lowered into container, until dipping to the
till mark on the spindle shaft and was then run at 50 rpm. The pH was determined with a
digital pH meter (Labman Scientific Instruments Pvt. Ltd., Tamil Nadu, India) that used
a glass electrode at room temperature.4
Determination of cloud point. Cloud point is the temperature at which transparent
microemulsion become cloudy and phase separation starts.15 It was conducted as follows:
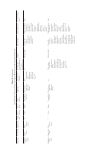
Table I
Composition and Characterization of Ketoconazole Loaded Microemulsion (2:1)
Batch Ketoconazole
(%w/w)
Omix
(TTO +coconut)
(2:1)
Smix (Tween
80 +propylene
glycol) (2:1)
Viscosity
(cp)
pH Cloud
point
(°C)
Drug
content (%)
F1 2 8.744% 10.65% 154 5.32 ± 0.21 53 ± 0.4 84% ± 0.02
F2 2 45.77% 43.82% 958 5.56 ± 0.20 82 ± 1.1 89% ± 0.03
F3 2 19.40% 41.17% 635 5.52 ± 0.34 73 ± 0.7 85% ± 0.01
F4 2 3.88% 8.97% 102 5.30 ± 0.18 51 ± 1.5 33% ± 0.03
F5 2 50.44% 25.46% 249 5.75 ± 0.09 57 ± 0.3 75% ± 0.01
F6 2 30.03% 25.17% 457 5.43 ± 0.16 54 ± 1.3 64% ± 0.04