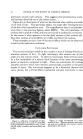
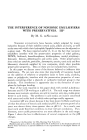
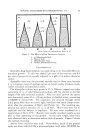
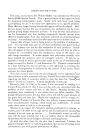
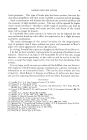
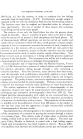
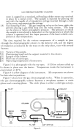
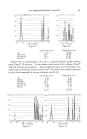
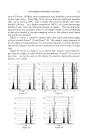
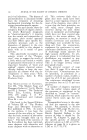
70 JOURNAL OF THE SOCIETY OF COSMETIC CHEMISTS Figtire 2. reasons of convenience, after it was found that other ETO nonionics be- hayed sire i larl y. pH OF No•o•cs • SoJ•t'Tm• The pH of 2 per cent solutions of the nonionics was determined before and after autoclaving, in deionized water and in Jaag medium. All gave pH readings in the acid range. In water the pH varied from 3.2 to 6.4 before autoclaving with most being in the 5.0 to 5.2 range while in Jaag medium they were from 3.2 to 5.7 with most showing a pH of 4.7. De- ionized water had a p}[ of 6.5 while Jaag medium exhibits a pH of 5.1. After autoclaving, some became slightly more acid others increased in pH a few decimals, but all were acid. EFFECT OF pH The preservative added to a finished product acts in a physical or chem-

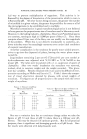
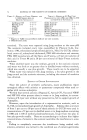
NONIONIC EMULSIFIERS WITH PRESERVATIVES. III 71 ical way to prevent multiplication of organisms. This activity is in- fluenced by the degree of dissociation of the preservative which in turn is influenced by pH. All other factors being constant, the greater the number of microbials in a given volume, the greater the possibility for some or all of the microorganisms to be uninhibited and to multiply. Microbial contamination in good manufacturing practice is not believed to be as great as the proportionate size of inoculum used in laboratory work. However, in the baking industry, Alspergillus, Mucor and Penicillium spores are common, running as high as 11,000 per gram of flour (5). Since these comprise about 10 per cent of the flora, one can readily see the magnitude of the problem. While this is not directly translatable to cosmetics, air- borne microbes must be exceedingly numerous even under ideal conditions of cosmetic manufacture. A further complication is the tendency for poorly water soluble preserv- atives to go into the dispersed oil phase, leaving the water phase unpro- tected (6). Jaag medium containing 2 per cent G-3720 and 0.1 per cent methyl p- hydroxybenzoate was adjusted with N/10 HC1 or N/10 NaOH to the proper pH. The tubes were inoculated with a 1 cc. suspension of spores of ztspergi#us. After two weeks' incubation the mycelium was removed, washed, dried to constant weight and the weight recorded. This proce- dure has variables. Results obtained with it are said to be difficult of inter- pretation according to Molho and Lacroix (7). Table 1 shows the compar- ison of visual observation denoted by plusses, with actual weights of mycelium. The figures are all proportionate to the sample with the lowest weight of mycelium. TAm. E 1--EFFECT OF pH o• MYCELIUM GROWTH TABLE 2--EFFECT or SIZE OF INOCULUM Wt. ON MYCELIUM PRODUCED pH Mycelium Visual Wt. Inoculum Visual Mycelium 7.5 1 7.0 1.3 +++ 0.1 +++ 1.0 6.5 1.6 ++++ 0.2 +++ 1.24 6.0 1.3 +++ 0.4 ++++ 1.07 5.5 2.0 ++++ 0.6 ++++ 1.17 5.0 1.6 +++ 0.8 ++++ 1.32 4.5 1.2 +++ 1.0 ++++ 2.61 4.0 1.7 One sees a variation here but no consistent change unless we take the figures at pH 5.5 and those at pH 7.5 where there is a 100 per cent dif- ference. This may be the point of optimum growth. But for all practical purposes, there is significant and damaging growth at all pH levels. Sim- ilar results were obtained with dehydroacetic acid.
Purchased for the exclusive use of nofirst nolast (unknown)
From: SCC Media Library & Resource Center (library.scconline.org)