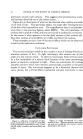
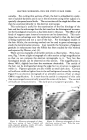
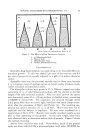
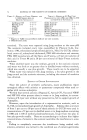
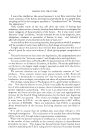
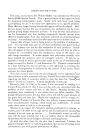
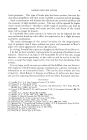
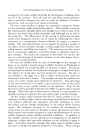
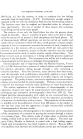
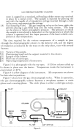
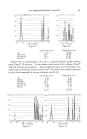
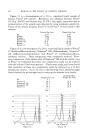
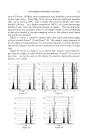
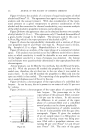
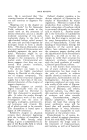
GAS CHROMATOGRAPHIC ANALYSIS 103 Figure 13 is a chromatogram of a 9.15 cc. sample, at 150 min. Hg, of the vaporized liquid from a Freon © 11, Freon © 12, ethyl alcohol solution. Alcohol has a rather low vapor pres- sure at the temperature at which the chromatograph was being operated. In order to reduce the analysis time, THERMAL CONDUCTIVITIES OF ETHYL ALCO- HOL AND DICHLORODIFLUOROMETHANE (TYPE 11 PROPELLENT) AT 40øC. (104øF.) k = Btu./hr./sq. ft./øF./ft. kEthyl Alcohol 0.0089 -- -- 1.39 kDiehlorodifl ......... th .... 0.0064 Figtire 15. the flow rate was increased and the column length shortened to 4 feet. Under these conditions, it was found that the standard columns being used did not permit adequate resolution between ethyl alcohol and methylene chloride. A number of new columns were investigated, and it was found that a 4- foot Span 85 column was best for this mixture. It will be noted that the percentages found by analysis as shown in the following chart did not check the percentage used to make up the synthetic mixture. An explanation of this will be given later in the discussion. Synthetic Mix, Weight Per Cent Weight Per Cent Air 0. 046 Freon© 12 45.4 3} i0 Freon© 11 38.4 35.0 Ethyl Alcohol 16.2 30.0 Figure 14 is a chromatogram of a 0.15 cc. sample at 150 mm. Hg of the vaporized liquid from a Freon © 11, Freon © 12, methylene chloride and . ethyl alcohol solution. The resolution between methylene chloride and ethyl alcohol was not complete, but it was sufficient to permit the accurate analysis of these two components using the peak height method. Here again it was found that the percentages found as shown on the chart above did not check the amounts put into the synthetic mix. From known samples of alcohol it was found that there was a factor of 1.4 of the amount known to the amount analyzed when peak areas were used. The factor OPERATING PRESSURES, MM. Ho, for ETHYL ALCOHOL AT 20øC. ANI• 40øC. Vapor Pressure Ethyl Alcohol Mole Fraction Ethyl Alcohol Maximum Total Pressure % Ethyl Alcohol Maximum Total Pressure, Mm. Hg Mol Fraction 20øC. 40øC. 30 25 0.55 80 ram. 246 ram. 0.44 100 ram. 308 ram. V.P. Ethyl Alcohol, 20øC .... 43.9 mm. V.P. Ethyl Alcohol, 40øC .... 135.3 min. Figure 16.

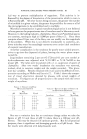
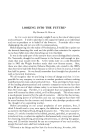
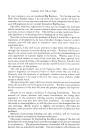
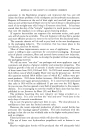
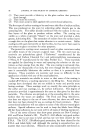
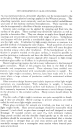
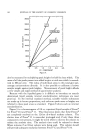
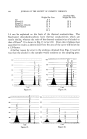
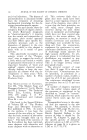
104 JOURNAL OF THE SOCIETY OF COSMETIC CHEMISTS Synthetic Mix, Weight Per Cent Weight Per Cent Air 0.2 Freon© 12 32.4 2• i0 Freon© 11 31.4 25.0 Methylene Chloride 23.5 25.0 Ethyl Alcohol 12.4 25.0 99.9 1.4 can be explained on the basis of the thermal conductivities. The fluorinated chlorohydrocarbons have thermal conductivities which are nearly similar, whereas the ratio of the thermal conductivity of alcohol to that of Freon © 11 is shown in Fig. 15 to be 1.39. From this it follows that quantitative results as determined from the area of the curve will be low by a 1.39 factor. A further reason for error in the analyses obtained from Figs. 13 and 14 was that the alcohol in the samples would condense at the sampling pres- •oo ............ lOo ...... •:-- ' ' j hlO. 80 •__• __ •o o. o--,,, • i- o._ - • 0 -- a a_ a_ 60 o 0 60 --o o T % 40 • --• I'--•-- O3-- Ld 20 2 0 TIME TIME Figure 17. Figure 18. 100 8O 6O 4O TIME Figure 19. •J i -- I I I 100 ' I , I I I I I ' I I I I I f 60 8 40-- •, _z z__ • o. o. I i i i i i i i i i i i i I i TIME Figure 20.
Purchased for the exclusive use of nofirst nolast (unknown)
From: SCC Media Library & Resource Center (library.scconline.org)